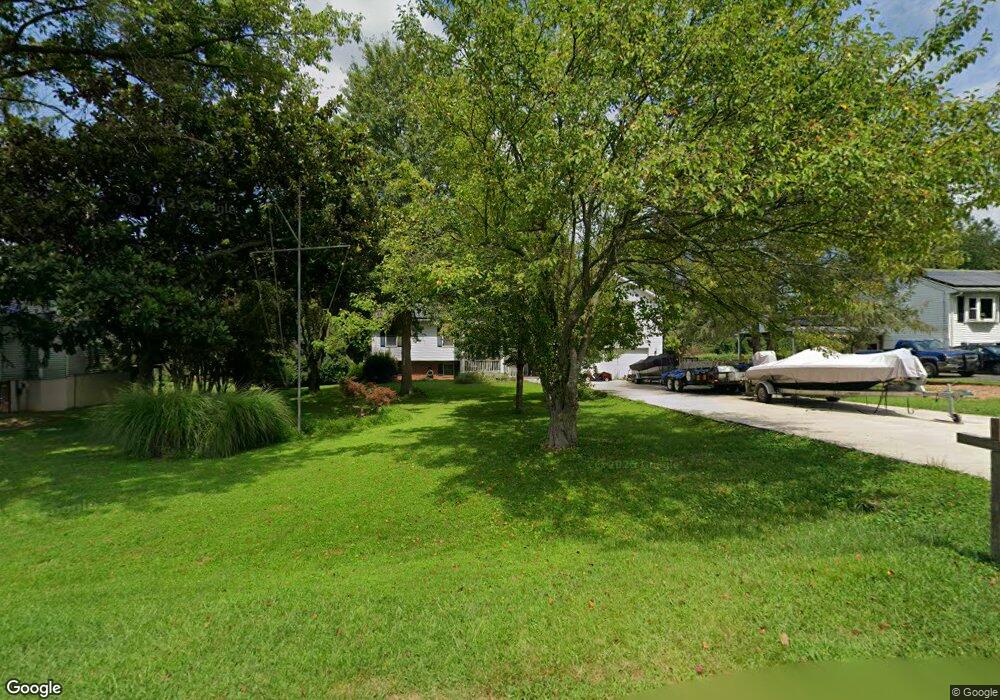
99 Honeysuckle Dr Port Deposit, MD 21904
Estimated Value: $399,000 - $564,000
--
Bed
3
Baths
2,274
Sq Ft
$202/Sq Ft
Est. Value
About This Home
This home is located at 99 Honeysuckle Dr, Port Deposit, MD 21904 and is currently estimated at $459,863, approximately $202 per square foot. 99 Honeysuckle Dr is a home located in Cecil County with nearby schools including Bainbridge Elementary School, Perryville Middle School, and Perryville High School.
Ownership History
Date
Name
Owned For
Owner Type
Purchase Details
Closed on
Jan 2, 2024
Sold by
Barnhart Scott E
Bought by
Barnhart Nelissa
Current Estimated Value
Purchase Details
Closed on
May 19, 2016
Sold by
Barnhart Scott E and King Sharon L
Bought by
Barnhart Scott E
Purchase Details
Closed on
May 8, 2002
Sold by
Barnhart Scott E
Bought by
Barnhart Scott E and King Sharon L
Purchase Details
Closed on
Jan 26, 1998
Sold by
Vangilder John A and Vangilder Patricia C
Bought by
Barnhart Scott E
Purchase Details
Closed on
Oct 30, 1986
Sold by
Montgomery Brothers, Inc.
Bought by
Vangilder John A and Vangilder Patricia C
Home Financials for this Owner
Home Financials are based on the most recent Mortgage that was taken out on this home.
Original Mortgage
$60,000
Interest Rate
9.95%
Create a Home Valuation Report for This Property
The Home Valuation Report is an in-depth analysis detailing your home's value as well as a comparison with similar homes in the area
Home Values in the Area
Average Home Value in this Area
Purchase History
| Date | Buyer | Sale Price | Title Company |
|---|---|---|---|
| Barnhart Nelissa | $2,500 | None Listed On Document | |
| Barnhart Scott E | -- | Attorney | |
| Barnhart Scott E | -- | -- | |
| Barnhart Scott E | $125,000 | -- | |
| Vangilder John A | $70,000 | -- |
Source: Public Records
Mortgage History
| Date | Status | Borrower | Loan Amount |
|---|---|---|---|
| Previous Owner | Vangilder John A | $60,000 | |
| Closed | Barnhart Scott E | -- |
Source: Public Records
Tax History Compared to Growth
Tax History
| Year | Tax Paid | Tax Assessment Tax Assessment Total Assessment is a certain percentage of the fair market value that is determined by local assessors to be the total taxable value of land and additions on the property. | Land | Improvement |
|---|---|---|---|---|
| 2025 | $3,926 | $353,267 | $0 | $0 |
| 2024 | $3,393 | $336,533 | $0 | $0 |
| 2023 | $2,892 | $319,800 | $62,300 | $257,500 |
| 2022 | $3,609 | $315,133 | $0 | $0 |
| 2021 | $3,537 | $310,467 | $0 | $0 |
| 2020 | $3,587 | $305,800 | $62,300 | $243,500 |
| 2019 | $3,379 | $287,733 | $0 | $0 |
| 2018 | $3,170 | $269,667 | $0 | $0 |
| 2017 | $2,962 | $251,600 | $0 | $0 |
| 2016 | $2,834 | $251,600 | $0 | $0 |
| 2015 | $2,834 | $251,600 | $0 | $0 |
| 2014 | $3,305 | $252,900 | $0 | $0 |
Source: Public Records
Map
Nearby Homes
- 91 Honeysuckle Dr
- 145 Honeysuckle Dr
- 4 Brenda St
- 176 Rowland Rd
- TBD Rowland Dr
- TBD Pine Needle Ct
- 1200 Jacob Tome Memorial Hwy
- 27 Behm Ln
- 55 Marian Dr
- 236 N Main St
- 21 Country Ln
- 111 N Main St
- 26 Orchard Dr
- 0 Liberty Grove Rd Unit MDCC2015324
- 317 Rowland Dr
- 18 S Main St
- 21 High St
- 84 Clematis Way
- TBD White Spruce Way
- 120 Beechwood Dr
- 107 Honeysuckle Dr
- 115 Honeysuckle Dr
- 85 Honeysuckle Dr
- 92 Honeysuckle Dr
- 108 Honeysuckle Dr
- 77 Honeysuckle Dr
- 84 Honeysuckle Dr
- 100 Honeysuckle Dr
- 123 Honeysuckle Dr
- 69 Honeysuckle Dr
- 70 Honeysuckle Dr
- 130 Honeysuckle Dr
- 61 Honeysuckle Dr
- 62 Honeysuckle Dr
- 76 Honeysuckle Dr
- 138 Honeysuckle Dr
- 116 Honeysuckle Dr
- 53 Honeysuckle Dr
- 54 Honeysuckle Dr
- 74 Honeysuckle Dr