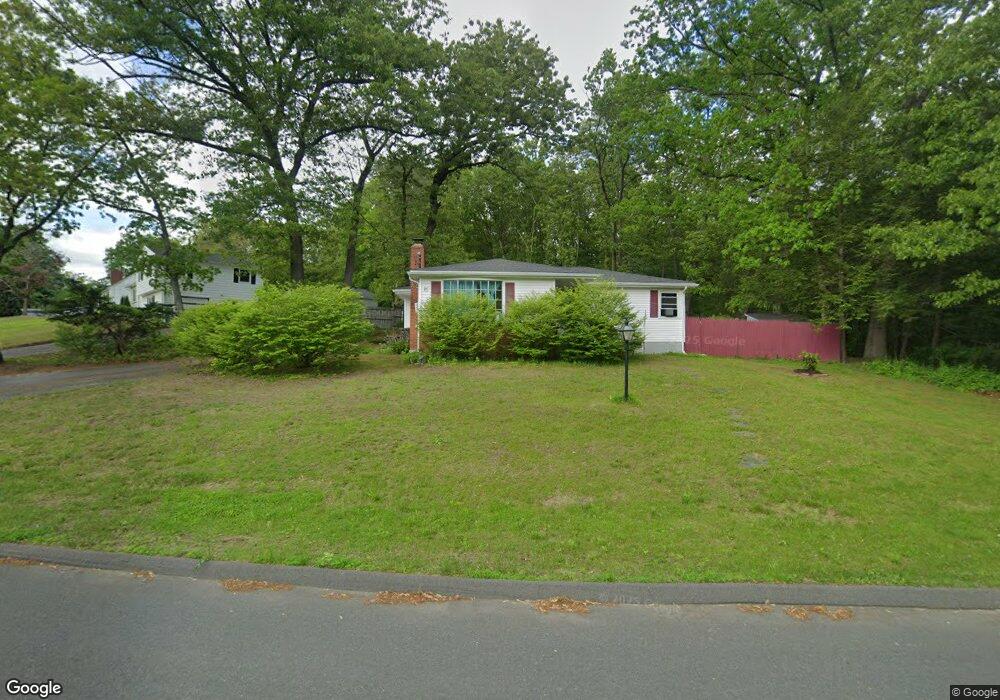
99 Joseph Ave Westfield, MA 01085
Estimated Value: $345,890 - $426,000
3
Beds
1
Bath
1,092
Sq Ft
$339/Sq Ft
Est. Value
About This Home
This home is located at 99 Joseph Ave, Westfield, MA 01085 and is currently estimated at $370,473, approximately $339 per square foot. 99 Joseph Ave is a home located in Hampden County with nearby schools including Westfield High School, Westfield Christian Academy, and Saint Mary High School.
Ownership History
Date
Name
Owned For
Owner Type
Purchase Details
Closed on
Mar 24, 2000
Sold by
Cavanaugh Kathleen L
Bought by
Rodriguez Jose E and Rodriguez Migdalia
Current Estimated Value
Home Financials for this Owner
Home Financials are based on the most recent Mortgage that was taken out on this home.
Original Mortgage
$118,405
Interest Rate
8.31%
Mortgage Type
Purchase Money Mortgage
Purchase Details
Closed on
Mar 25, 1987
Sold by
Carellas Theodore
Bought by
Cavanaugh James J
Home Financials for this Owner
Home Financials are based on the most recent Mortgage that was taken out on this home.
Original Mortgage
$100,350
Interest Rate
9.03%
Mortgage Type
Purchase Money Mortgage
Create a Home Valuation Report for This Property
The Home Valuation Report is an in-depth analysis detailing your home's value as well as a comparison with similar homes in the area
Home Values in the Area
Average Home Value in this Area
Purchase History
| Date | Buyer | Sale Price | Title Company |
|---|---|---|---|
| Rodriguez Jose E | $118,500 | -- | |
| Cavanaugh James J | $111,500 | -- |
Source: Public Records
Mortgage History
| Date | Status | Borrower | Loan Amount |
|---|---|---|---|
| Open | Cavanaugh James J | $117,627 | |
| Closed | Cavanaugh James J | $118,405 | |
| Previous Owner | Cavanaugh James J | $100,350 |
Source: Public Records
Tax History
| Year | Tax Paid | Tax Assessment Tax Assessment Total Assessment is a certain percentage of the fair market value that is determined by local assessors to be the total taxable value of land and additions on the property. | Land | Improvement |
|---|---|---|---|---|
| 2025 | $4,041 | $266,200 | $117,600 | $148,600 |
| 2024 | $4,080 | $255,500 | $106,900 | $148,600 |
| 2023 | $3,800 | $232,200 | $101,800 | $130,400 |
| 2022 | $3,800 | $205,500 | $90,900 | $114,600 |
| 2021 | $3,676 | $194,700 | $85,700 | $109,000 |
| 2020 | $3,586 | $186,300 | $85,700 | $100,600 |
| 2019 | $3,501 | $178,000 | $81,600 | $96,400 |
| 2018 | $3,446 | $178,000 | $81,600 | $96,400 |
| 2017 | $3,399 | $175,000 | $82,800 | $92,200 |
| 2016 | $3,402 | $175,000 | $82,800 | $92,200 |
| 2015 | $3,245 | $175,000 | $82,800 | $92,200 |
| 2014 | $2,425 | $175,000 | $82,800 | $92,200 |
Source: Public Records
Map
Nearby Homes
- 242 Eastwood Dr
- 103 Woodcliff Dr
- 120 Woodcliff Dr
- 19 Sherwood Ave
- 24 Francis St
- 0 E Mountain Rd
- 119 Union St Unit 4
- 24 Sunflower Ln Unit B
- 189 Springfield Rd Unit 23
- 61 Ridgecrest Dr
- 18 Noble St
- 0 Feeding Hills Rd
- 19 Arch Rd
- 63 George St
- 33 George St
- 25 Dubois St
- 0 Lockhouse Rd Unit 73473161
- 83 Mechanic St
- 34 High Meadow Dr
- 117 Sibley Ave
Your Personal Tour Guide
Ask me questions while you tour the home.