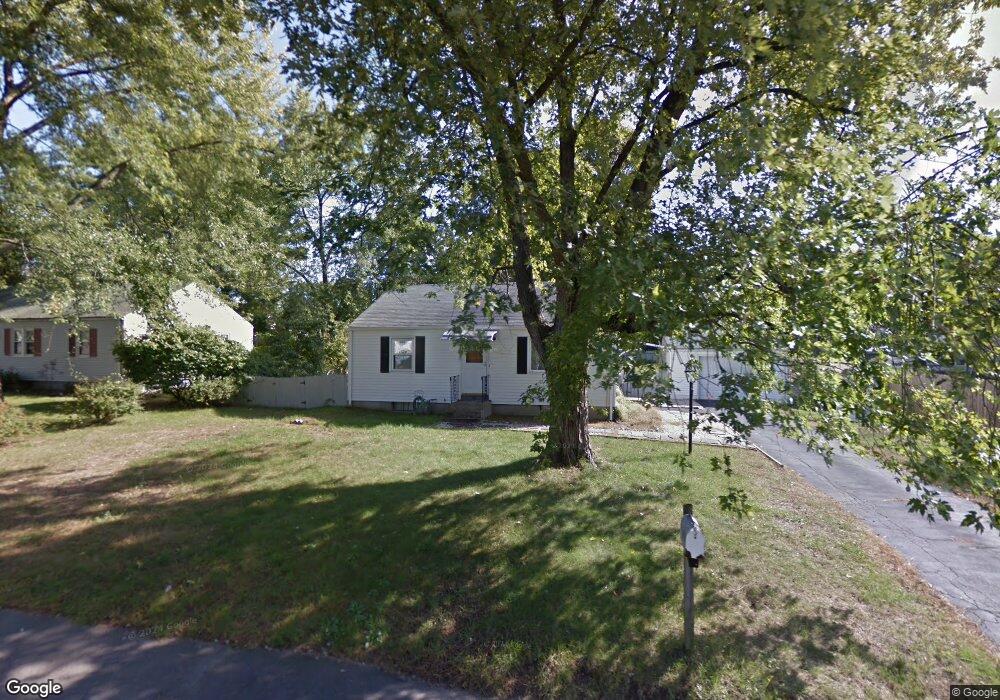
99 Juniper Dr Springfield, MA 01119
Sixteen Acres NeighborhoodEstimated Value: $246,000 - $304,000
2
Beds
1
Bath
768
Sq Ft
$348/Sq Ft
Est. Value
About This Home
This home is located at 99 Juniper Dr, Springfield, MA 01119 and is currently estimated at $267,036, approximately $347 per square foot. 99 Juniper Dr is a home located in Hampden County with nearby schools including Mary M. Lynch Elementary School, John J Duggan Middle, and Springfield Central High School.
Ownership History
Date
Name
Owned For
Owner Type
Purchase Details
Closed on
Jun 16, 1992
Sold by
Cummings Lester C
Bought by
Bryant Rene M and Bryant Janice D
Current Estimated Value
Home Financials for this Owner
Home Financials are based on the most recent Mortgage that was taken out on this home.
Original Mortgage
$54,000
Interest Rate
8.79%
Mortgage Type
Purchase Money Mortgage
Create a Home Valuation Report for This Property
The Home Valuation Report is an in-depth analysis detailing your home's value as well as a comparison with similar homes in the area
Home Values in the Area
Average Home Value in this Area
Purchase History
| Date | Buyer | Sale Price | Title Company |
|---|---|---|---|
| Bryant Rene M | $67,500 | -- |
Source: Public Records
Mortgage History
| Date | Status | Borrower | Loan Amount |
|---|---|---|---|
| Open | Bryant Rene M | $53,800 | |
| Closed | Bryant Rene M | $54,000 | |
| Previous Owner | Bryant Rene M | $53,726 | |
| Previous Owner | Bryant Rene M | $11,000 |
Source: Public Records
Tax History
| Year | Tax Paid | Tax Assessment Tax Assessment Total Assessment is a certain percentage of the fair market value that is determined by local assessors to be the total taxable value of land and additions on the property. | Land | Improvement |
|---|---|---|---|---|
| 2025 | $3,269 | $208,500 | $52,400 | $156,100 |
| 2024 | $2,982 | $185,700 | $52,400 | $133,300 |
| 2023 | $2,936 | $172,200 | $49,900 | $122,300 |
| 2022 | $3,077 | $163,500 | $49,900 | $113,600 |
| 2021 | $2,678 | $141,700 | $45,300 | $96,400 |
| 2020 | $2,611 | $133,700 | $45,300 | $88,400 |
| 2019 | $2,458 | $124,900 | $45,300 | $79,600 |
| 2018 | $2,454 | $124,700 | $45,300 | $79,400 |
| 2017 | $2,493 | $126,800 | $45,300 | $81,500 |
| 2016 | $2,434 | $123,800 | $45,300 | $78,500 |
| 2015 | $2,360 | $120,000 | $45,300 | $74,700 |
Source: Public Records
Map
Nearby Homes
Your Personal Tour Guide
Ask me questions while you tour the home.