99 Loring Rd Levittown, NY 11756
Estimated Value: $667,000 - $791,048
4
Beds
3
Baths
1,904
Sq Ft
$383/Sq Ft
Est. Value
About This Home
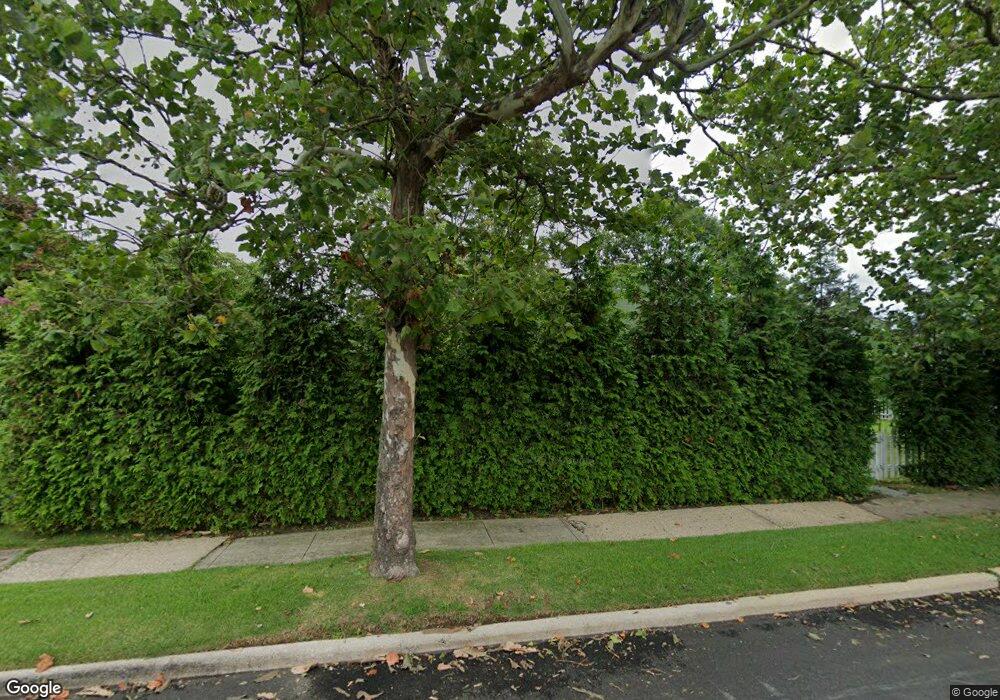
This home is located at 99 Loring Rd, Levittown, NY 11756 and is currently estimated at $729,024, approximately $382 per square foot. 99 Loring Rd is a home located in Nassau County with nearby schools including Abbey Lane Elementary School, Wisdom Lane Middle School, and Division Avenue Senior High School.
Ownership History
Date
Name
Owned For
Owner Type
Purchase Details
Closed on
Aug 22, 2014
Sold by
The Clayton Family Trust and Volz Janice L
Bought by
Centeno Alejandro M and Centeno Jesus A
Current Estimated Value
Home Financials for this Owner
Home Financials are based on the most recent Mortgage that was taken out on this home.
Original Mortgage
$294,556
Outstanding Balance
$224,682
Interest Rate
4.12%
Mortgage Type
Purchase Money Mortgage
Estimated Equity
$504,342
Create a Home Valuation Report for This Property
The Home Valuation Report is an in-depth analysis detailing your home's value as well as a comparison with similar homes in the area
Home Values in the Area
Average Home Value in this Area
Purchase History
| Date | Buyer | Sale Price | Title Company |
|---|---|---|---|
| Centeno Alejandro M | $300,000 | -- |
Source: Public Records
Mortgage History
| Date | Status | Borrower | Loan Amount |
|---|---|---|---|
| Open | Centeno Alejandro M | $294,556 |
Source: Public Records
Tax History Compared to Growth
Tax History
| Year | Tax Paid | Tax Assessment Tax Assessment Total Assessment is a certain percentage of the fair market value that is determined by local assessors to be the total taxable value of land and additions on the property. | Land | Improvement |
|---|---|---|---|---|
| 2025 | $14,280 | $436 | $251 | $185 |
| 2024 | $3,562 | $438 | $252 | $186 |
| 2023 | $13,718 | $454 | $261 | $193 |
| 2022 | $13,718 | $454 | $261 | $193 |
| 2021 | $18,460 | $432 | $248 | $184 |
| 2020 | $12,907 | $572 | $495 | $77 |
| 2019 | $12,099 | $612 | $519 | $93 |
| 2018 | $12,368 | $625 | $0 | $0 |
| 2017 | $8,230 | $625 | $387 | $238 |
| 2016 | $11,404 | $855 | $530 | $325 |
| 2015 | -- | $855 | $530 | $325 |
| 2014 | -- | $855 | $530 | $325 |
| 2013 | $2,904 | $855 | $530 | $325 |
Source: Public Records
Map
Nearby Homes