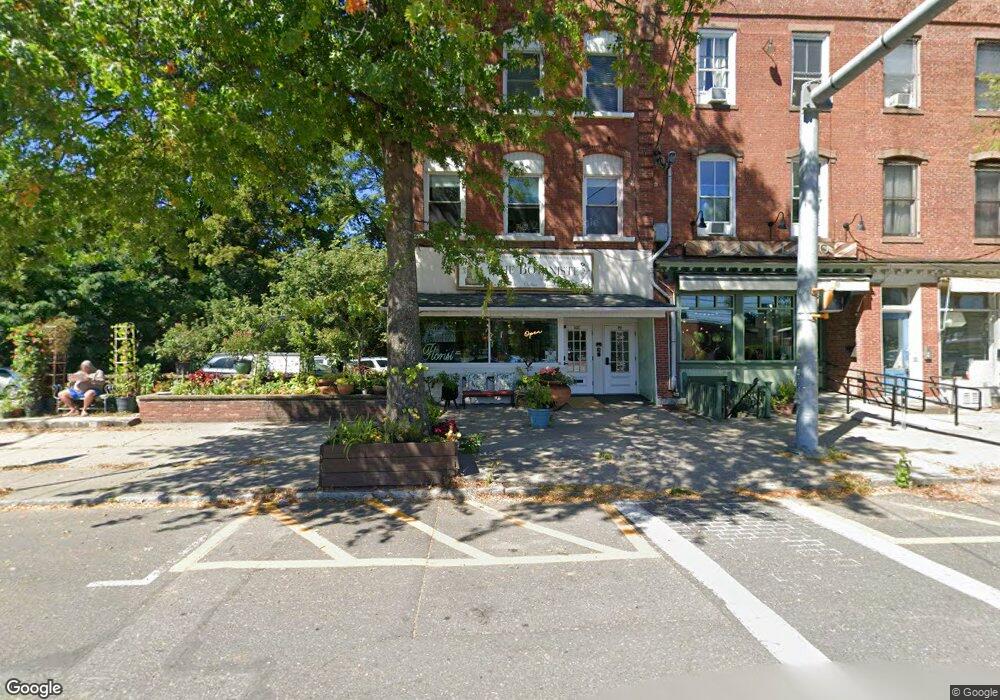
99 Main St Easthampton, MA 01027
Estimated Value: $548,095
4
Beds
2
Baths
3,556
Sq Ft
$154/Sq Ft
Est. Value
About This Home
This home is located at 99 Main St, Easthampton, MA 01027 and is currently estimated at $548,095, approximately $154 per square foot. 99 Main St is a home located in Hampshire County with nearby schools including Easthampton High School, Hilltown Cooperative Charter Public School, and Calvary Baptist Christian School.
Ownership History
Date
Name
Owned For
Owner Type
Purchase Details
Closed on
Aug 10, 1993
Sold by
Remillard Claire R
Bought by
Banas Michael R
Current Estimated Value
Home Financials for this Owner
Home Financials are based on the most recent Mortgage that was taken out on this home.
Original Mortgage
$106,000
Interest Rate
7.29%
Mortgage Type
Commercial
Create a Home Valuation Report for This Property
The Home Valuation Report is an in-depth analysis detailing your home's value as well as a comparison with similar homes in the area
Home Values in the Area
Average Home Value in this Area
Purchase History
| Date | Buyer | Sale Price | Title Company |
|---|---|---|---|
| Banas Michael R | $132,500 | -- | |
| Banas Michael R | $132,500 | -- |
Source: Public Records
Mortgage History
| Date | Status | Borrower | Loan Amount |
|---|---|---|---|
| Open | Banas Michael R | $319,000 | |
| Closed | Banas Michael R | $106,000 | |
| Closed | Banas Michael R | $12,000 |
Source: Public Records
Tax History
| Year | Tax Paid | Tax Assessment Tax Assessment Total Assessment is a certain percentage of the fair market value that is determined by local assessors to be the total taxable value of land and additions on the property. | Land | Improvement |
|---|---|---|---|---|
| 2025 | $4,797 | $350,900 | $109,900 | $241,000 |
| 2024 | $4,623 | $340,900 | $106,700 | $234,200 |
| 2023 | $4,276 | $291,900 | $94,000 | $197,900 |
| 2022 | $4,825 | $291,900 | $94,000 | $197,900 |
| 2021 | $5,867 | $291,900 | $94,000 | $197,900 |
| 2020 | $5,760 | $291,900 | $94,000 | $197,900 |
| 2019 | $5,614 | $278,300 | $94,000 | $184,300 |
| 2018 | $4,186 | $261,600 | $88,700 | $172,900 |
| 2017 | $4,075 | $251,400 | $85,300 | $166,100 |
| 2016 | $3,919 | $251,400 | $85,300 | $166,100 |
| 2015 | $3,809 | $251,400 | $85,300 | $166,100 |
Source: Public Records
Map
Nearby Homes
- 19 Nicols Way Unit 19
- 11 Dragon Cir
- 33 Knipfer Ave
- 2 Oak St
- 6 Wilton Rd
- M143 &152 Glendale St
- 385 Main St
- 131 West St Unit 131
- 336 Main St
- 41 South St Unit 11
- 12 Glen Cove Place Unit B
- 10 Glen Cove Place Unit A
- 6 S St & Abutting Lots
- 2 W Park Dr
- 98 Park Hill Rd
- 245 Park St
- 36 & 36R Holly Cir
- 4 Laurel Dr
- 296 Old Wilson Rd
- 967 Florence Rd
Your Personal Tour Guide
Ask me questions while you tour the home.