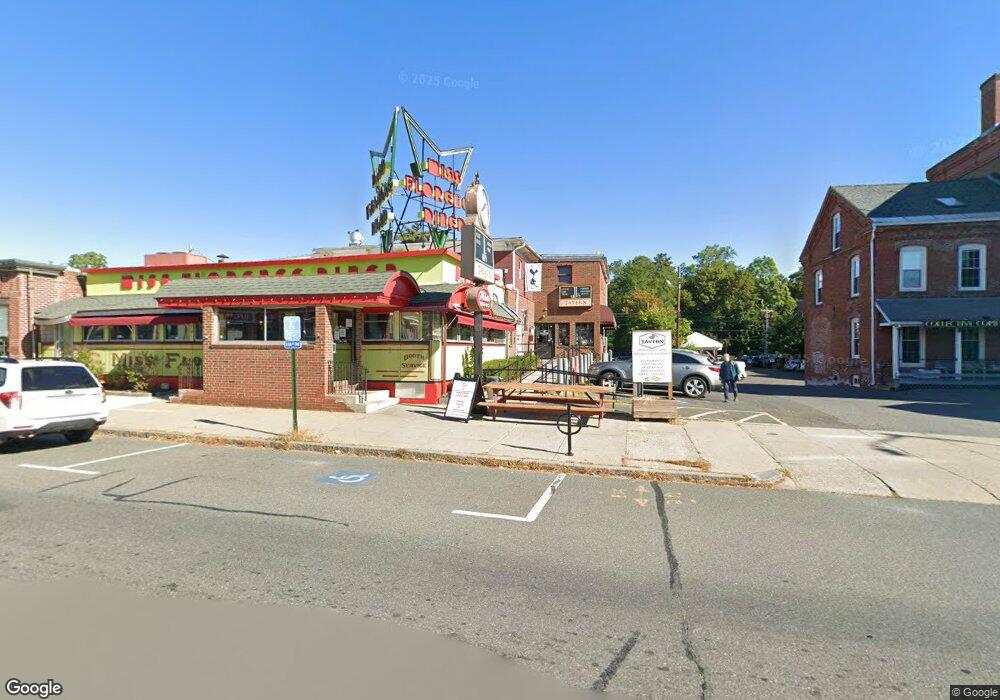
99 Main St Northampton, MA 01062
Florence NeighborhoodEstimated Value: $1,023,684
--
Bed
--
Bath
8,665
Sq Ft
$118/Sq Ft
Est. Value
About This Home
This home is located at 99 Main St, Northampton, MA 01062 and is currently estimated at $1,023,684, approximately $118 per square foot. 99 Main St is a home located in Hampshire County with nearby schools including Northampton High School, The Montessori School of Northampton, and Lander Grinspoon Academy.
Ownership History
Date
Name
Owned For
Owner Type
Purchase Details
Closed on
Jun 3, 2020
Sold by
Hampshire Council Of Gove
Bought by
Cap Asset Mgmt & Maintenanc
Current Estimated Value
Purchase Details
Closed on
Sep 19, 2002
Sold by
Alexander Maurice J and Alexander Thomas E
Bought by
Florence Family Ent
Home Financials for this Owner
Home Financials are based on the most recent Mortgage that was taken out on this home.
Original Mortgage
$400,000
Interest Rate
6.36%
Mortgage Type
Commercial
Create a Home Valuation Report for This Property
The Home Valuation Report is an in-depth analysis detailing your home's value as well as a comparison with similar homes in the area
Home Values in the Area
Average Home Value in this Area
Purchase History
| Date | Buyer | Sale Price | Title Company |
|---|---|---|---|
| Cap Asset Mgmt & Maintenanc | -- | None Available | |
| Florence Family Ent | $400,000 | -- |
Source: Public Records
Mortgage History
| Date | Status | Borrower | Loan Amount |
|---|---|---|---|
| Previous Owner | Florence Family Ent | $400,000 |
Source: Public Records
Tax History Compared to Growth
Tax History
| Year | Tax Paid | Tax Assessment Tax Assessment Total Assessment is a certain percentage of the fair market value that is determined by local assessors to be the total taxable value of land and additions on the property. | Land | Improvement |
|---|---|---|---|---|
| 2025 | $14,657 | $1,052,200 | $315,600 | $736,600 |
| 2024 | $13,320 | $876,900 | $315,600 | $561,300 |
| 2023 | $14,357 | $906,400 | $315,600 | $590,800 |
| 2022 | $14,890 | $832,300 | $306,400 | $525,900 |
| 2021 | $14,523 | $836,100 | $306,400 | $529,700 |
| 2020 | $14,046 | $836,100 | $306,400 | $529,700 |
| 2019 | $14,099 | $811,700 | $300,400 | $511,300 |
| 2018 | $13,831 | $811,700 | $300,420 | $511,280 |
| 2017 | $13,547 | $811,700 | $300,420 | $511,280 |
| 2016 | $13,117 | $811,700 | $300,420 | $511,280 |
| 2015 | $12,825 | $811,700 | $300,420 | $511,280 |
| 2014 | $12,492 | $811,700 | $300,420 | $511,280 |
Source: Public Records
Map
Nearby Homes
- 76 Maple St
- 67 Park St Unit A
- 67 Park St Unit B
- 67 Park St Unit D
- 84 N Main St
- 152 S Main St Unit 4
- 225 Nonotuck St Unit C
- 37 Landy Ave
- 96 Rick Dr
- 0 Terrace Ln
- 11 Norwood Ave
- 325 Riverside Dr
- 63 Riverside Dr
- 321 Riverside Dr
- 384 Spring St
- 76 Cooke Ave
- 61 Woodlawn Ave
- 14 Arlington St
- 39 Matthew Dr
- 74 Barrett St Unit 105
- 143 Main St
- 89 Main St Unit D
- 89 Main St Unit 93
- 89 Main St Unit 93
- 89 Main St
- 89 Main St Unit 3
- 89 Main St Unit 5
- 89 Main St Unit 6
- 89 Main St Unit 4
- 89-93 Main St
- 89 Main St
- 91 Main St
- 100 Main St Unit D
- 100 Main St
- 100 Main St Unit . 1
- 1 Depot St
- 3 N Main St
- 13 N Main St Unit R
- 13 N Main St Unit F
- 1 N Main St