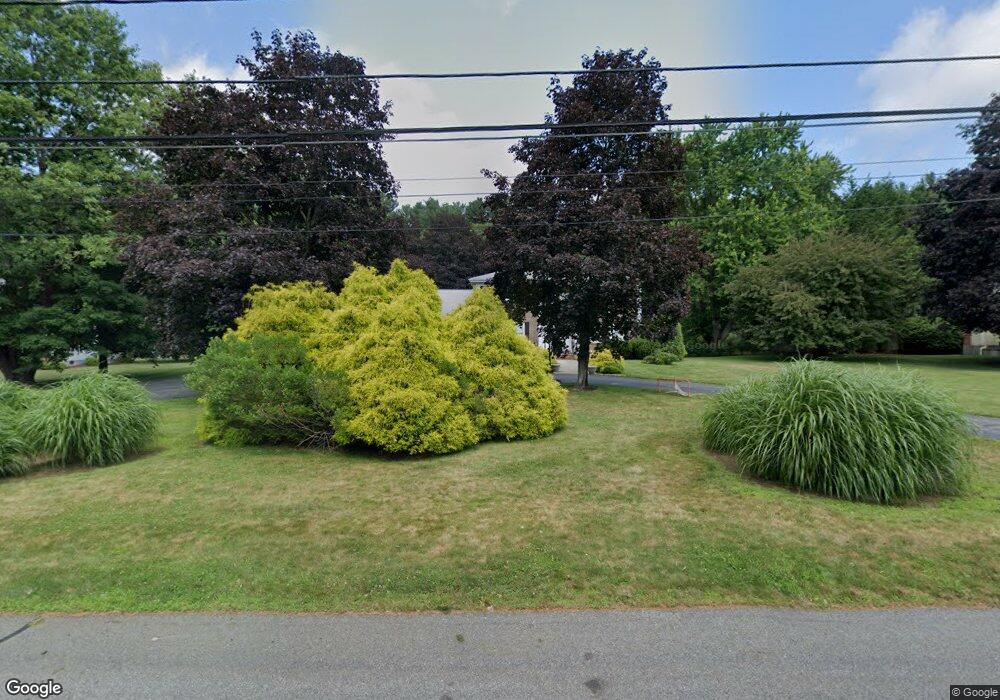
99 Oxbow Rd Needham, MA 02492
Estimated Value: $1,846,000 - $2,540,000
5
Beds
4
Baths
4,400
Sq Ft
$470/Sq Ft
Est. Value
About This Home
This home is located at 99 Oxbow Rd, Needham, MA 02492 and is currently estimated at $2,068,358, approximately $470 per square foot. 99 Oxbow Rd is a home located in Norfolk County with nearby schools including Newman Elementary School, High Rock Middle School, and Pollard Middle School.
Ownership History
Date
Name
Owned For
Owner Type
Purchase Details
Closed on
Jan 14, 2016
Sold by
Mcfarland Bernard and Mcfarland Marybeth
Bought by
Monaghan Development L
Current Estimated Value
Purchase Details
Closed on
Sep 24, 2004
Sold by
Guarino Guido and Guarino Isabella
Bought by
Mcfarland Bernard
Home Financials for this Owner
Home Financials are based on the most recent Mortgage that was taken out on this home.
Original Mortgage
$787,500
Interest Rate
5.89%
Mortgage Type
Purchase Money Mortgage
Create a Home Valuation Report for This Property
The Home Valuation Report is an in-depth analysis detailing your home's value as well as a comparison with similar homes in the area
Home Values in the Area
Average Home Value in this Area
Purchase History
| Date | Buyer | Sale Price | Title Company |
|---|---|---|---|
| Monaghan Development L | -- | -- | |
| Mcfarland Bernard | $1,050,000 | -- |
Source: Public Records
Mortgage History
| Date | Status | Borrower | Loan Amount |
|---|---|---|---|
| Previous Owner | Mcfarland Bernard | $787,500 |
Source: Public Records
Tax History
| Year | Tax Paid | Tax Assessment Tax Assessment Total Assessment is a certain percentage of the fair market value that is determined by local assessors to be the total taxable value of land and additions on the property. | Land | Improvement |
|---|---|---|---|---|
| 2025 | $16,623 | $1,568,200 | $893,300 | $674,900 |
| 2024 | $17,021 | $1,359,500 | $795,800 | $563,700 |
| 2023 | $17,081 | $1,309,900 | $795,800 | $514,100 |
| 2022 | $15,536 | $1,162,000 | $669,500 | $492,500 |
| 2021 | $15,141 | $1,162,000 | $669,500 | $492,500 |
| 2020 | $14,921 | $1,194,600 | $669,600 | $525,000 |
| 2019 | $14,643 | $1,181,800 | $669,600 | $512,200 |
| 2018 | $14,040 | $1,181,800 | $669,600 | $512,200 |
| 2017 | $13,700 | $1,152,200 | $704,600 | $447,600 |
| 2016 | $13,353 | $1,157,100 | $704,600 | $452,500 |
| 2015 | $13,064 | $1,157,100 | $704,600 | $452,500 |
| 2014 | $13,261 | $1,139,300 | $704,600 | $434,700 |
Source: Public Records
Map
Nearby Homes
- 1780 Central Ave
- 365 Charles River St
- 24 Moseley Ave
- 37 Carleton Dr
- 34 Stratford Rd
- 60 Claybrook Rd
- 62 Claybrook Rd
- 52 Willow St
- 8 Crestview Rd
- 189 Bridle Trail Rd
- 1 Mill St
- 68 Locust Ln
- 389 Grove St
- 95 Deerfield Rd
- 333 Cartwright Rd
- 182 Winding River Rd
- 620 High Rock St
- 12 Winding River Cir
- 222 Grove St
- 957 South St
Your Personal Tour Guide
Ask me questions while you tour the home.