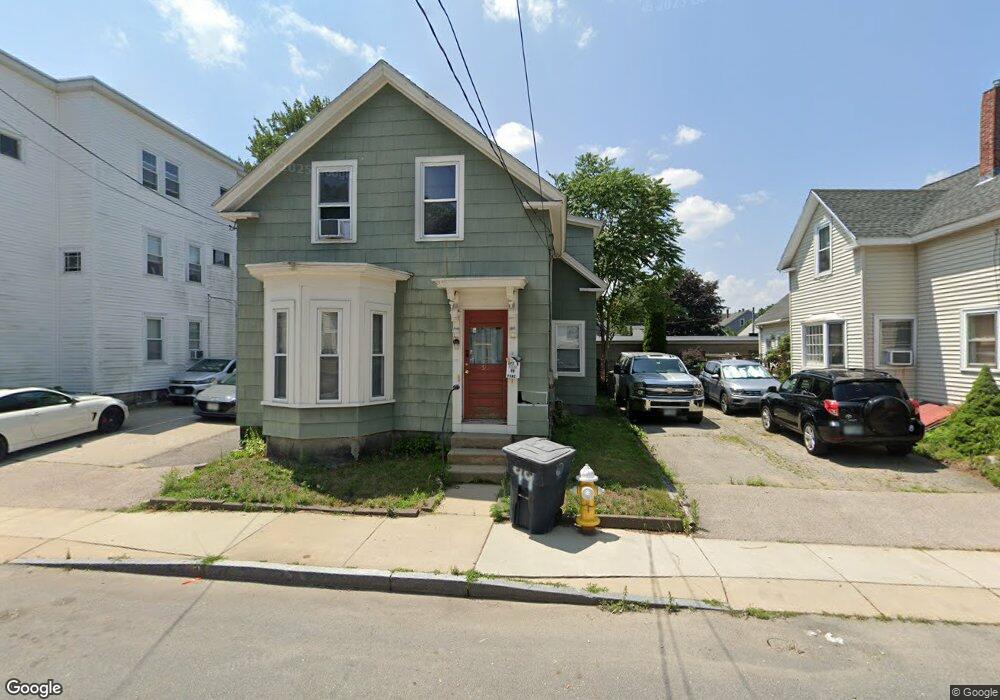
99 Pine St Unit 991/2 Nashua, NH 03060
South End Nashua NeighborhoodEstimated Value: $539,000 - $622,000
15
Beds
3
Baths
2,366
Sq Ft
$240/Sq Ft
Est. Value
About This Home
This home is located at 99 Pine St Unit 991/2, Nashua, NH 03060 and is currently estimated at $568,667, approximately $240 per square foot. 99 Pine St Unit 991/2 is a home located in Hillsborough County with nearby schools including Ledge Street Elementary School, Fairgrounds Middle School, and Nashua High School South.
Ownership History
Date
Name
Owned For
Owner Type
Purchase Details
Closed on
Jun 1, 2010
Sold by
Fnma
Bought by
Ferrazzani Scott
Current Estimated Value
Purchase Details
Closed on
Dec 7, 2009
Sold by
Joshua Guy and Fnma
Bought by
Fnma
Purchase Details
Closed on
Aug 3, 2005
Sold by
Connolly Francis X
Bought by
Joshua Guy J
Home Financials for this Owner
Home Financials are based on the most recent Mortgage that was taken out on this home.
Original Mortgage
$238,400
Interest Rate
5.63%
Mortgage Type
Purchase Money Mortgage
Purchase Details
Closed on
Nov 1, 2000
Sold by
Ruth M Mcglynn Est
Bought by
Connolly Francis X
Home Financials for this Owner
Home Financials are based on the most recent Mortgage that was taken out on this home.
Original Mortgage
$49,300
Interest Rate
7.83%
Mortgage Type
Purchase Money Mortgage
Create a Home Valuation Report for This Property
The Home Valuation Report is an in-depth analysis detailing your home's value as well as a comparison with similar homes in the area
Home Values in the Area
Average Home Value in this Area
Purchase History
| Date | Buyer | Sale Price | Title Company |
|---|---|---|---|
| Ferrazzani Scott | $100,000 | -- | |
| Fnma | $237,300 | -- | |
| Joshua Guy J | $298,000 | -- | |
| Connolly Francis X | $32,600 | -- | |
| Connolly Francis X | $89,400 | -- |
Source: Public Records
Mortgage History
| Date | Status | Borrower | Loan Amount |
|---|---|---|---|
| Previous Owner | Connolly Francis X | $238,400 | |
| Previous Owner | Connolly Francis X | $49,300 |
Source: Public Records
Tax History Compared to Growth
Tax History
| Year | Tax Paid | Tax Assessment Tax Assessment Total Assessment is a certain percentage of the fair market value that is determined by local assessors to be the total taxable value of land and additions on the property. | Land | Improvement |
|---|---|---|---|---|
| 2024 | $6,447 | $405,500 | $112,100 | $293,400 |
| 2023 | $6,282 | $344,600 | $89,700 | $254,900 |
| 2022 | $6,227 | $344,600 | $89,700 | $254,900 |
| 2021 | $5,088 | $219,100 | $56,800 | $162,300 |
| 2020 | $4,954 | $219,100 | $56,800 | $162,300 |
| 2019 | $4,768 | $219,100 | $56,800 | $162,300 |
| 2018 | $4,647 | $219,100 | $56,800 | $162,300 |
| 2017 | $4,281 | $166,000 | $54,300 | $111,700 |
| 2016 | $4,162 | $166,000 | $54,300 | $111,700 |
| 2015 | $4,072 | $166,000 | $54,300 | $111,700 |
Source: Public Records
Map
Nearby Homes
- 29 Wilder St
- 71 Vine St Unit 713/4
- 4 Badger St
- 8 Buck St Unit 10
- 30 Ledge St
- 38 Central St
- 121 Palm St
- 19.5 Balcom St
- 169A W Hollis St Unit 193
- 32-34 Grand Ave
- 6 Lake Ave
- 16-18 Perry Ave
- 15 Lovell St Unit 20
- 15 Lovell St Unit 3
- 15 Lovell St Unit 10
- 24 E Otterson St
- 70 Linwood St
- 30 Dexter St Unit 106
- 52 Main St Unit 402
- 7 Bitirnas St Unit U7