Estimated Value: $195,000 - $233,000
3
Beds
1
Bath
1,092
Sq Ft
$200/Sq Ft
Est. Value
About This Home
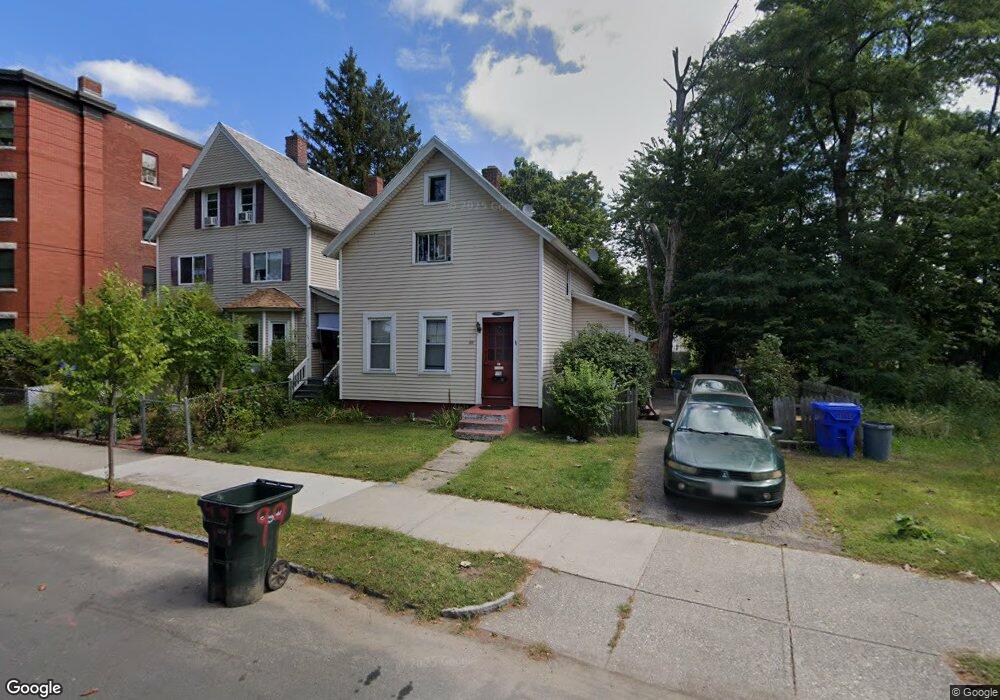
This home is located at 99 Pine St, Springfield, MA 01105 and is currently estimated at $217,953, approximately $199 per square foot. 99 Pine St is a home located in Hampden County with nearby schools including Milton Bradley School, M Marcus Kiley Middle, and High School Of Commerce.
Ownership History
Date
Name
Owned For
Owner Type
Purchase Details
Closed on
Feb 10, 1995
Sold by
Commercial Credit Corp
Bought by
Pierce John D and Pierce Eileen M
Current Estimated Value
Purchase Details
Closed on
Nov 3, 1993
Sold by
Shays William H
Bought by
Commercial Credit Corp
Purchase Details
Closed on
Oct 28, 1988
Sold by
Manning Stephen R
Bought by
Shays William H
Purchase Details
Closed on
Sep 30, 1988
Sold by
Molina Nelson
Bought by
Difranco Mark C
Create a Home Valuation Report for This Property
The Home Valuation Report is an in-depth analysis detailing your home's value as well as a comparison with similar homes in the area
Home Values in the Area
Average Home Value in this Area
Purchase History
| Date | Buyer | Sale Price | Title Company |
|---|---|---|---|
| Pierce John D | $17,900 | -- | |
| Commercial Credit Corp | $27,000 | -- | |
| Shays William H | $57,700 | -- | |
| Difranco Mark C | $28,000 | -- |
Source: Public Records
Mortgage History
| Date | Status | Borrower | Loan Amount |
|---|---|---|---|
| Open | Difranco Mark C | $34,521 | |
| Closed | Difranco Mark C | $22,061 |
Source: Public Records
Tax History
| Year | Tax Paid | Tax Assessment Tax Assessment Total Assessment is a certain percentage of the fair market value that is determined by local assessors to be the total taxable value of land and additions on the property. | Land | Improvement |
|---|---|---|---|---|
| 2025 | $2,390 | $152,400 | $25,600 | $126,800 |
| 2024 | $2,372 | $147,700 | $23,900 | $123,800 |
| 2023 | $2,228 | $130,700 | $22,800 | $107,900 |
| 2022 | $1,844 | $98,000 | $20,700 | $77,300 |
| 2021 | $1,748 | $92,500 | $18,900 | $73,600 |
| 2020 | $1,814 | $92,900 | $18,900 | $74,000 |
| 2019 | $1,633 | $83,000 | $18,900 | $64,100 |
| 2018 | $1,594 | $81,000 | $18,900 | $62,100 |
| 2017 | $1,423 | $72,400 | $15,100 | $57,300 |
| 2016 | $1,404 | $71,400 | $15,100 | $56,300 |
| 2015 | $1,430 | $72,700 | $15,100 | $57,600 |
Source: Public Records
Map
Nearby Homes
- 89 Cedar St
- 42 Florence St
- 0 Central St
- 20 Hawthorne St
- 10 Pine Street Ct
- 349 Walnut St
- 19 Quincy St
- 86 Alden St
- 63 Oak St
- 61 Dexter St
- 70-72 Manhattan St
- 118 Quincy St
- 0 Allen St (Ss)
- 41 Olive St
- 52 Central St Unit 504
- 50 Central St Unit 504
- 82 Central St Unit 304
- 66 Central St Unit 404
- 64 Central St Unit 403
- 68 Central St Unit 405
Your Personal Tour Guide
Ask me questions while you tour the home.