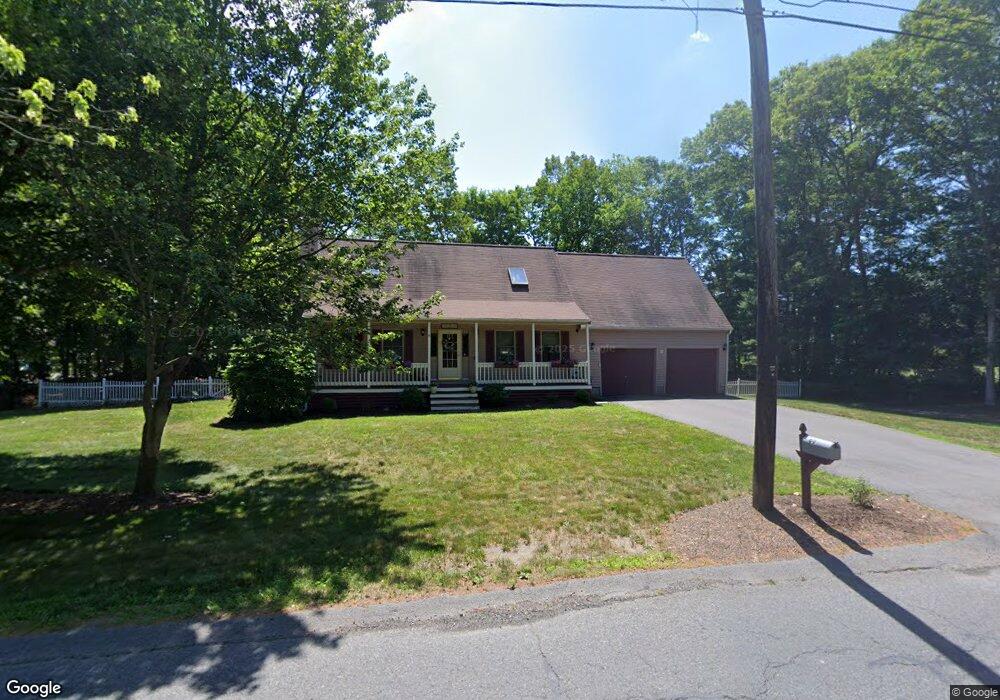
99 Prospect Hill St Taunton, MA 02780
Prospect Hill NeighborhoodEstimated Value: $539,000 - $720,000
3
Beds
2
Baths
1,469
Sq Ft
$415/Sq Ft
Est. Value
About This Home
This home is located at 99 Prospect Hill St, Taunton, MA 02780 and is currently estimated at $609,704, approximately $415 per square foot. 99 Prospect Hill St is a home located in Bristol County with nearby schools including Benjamin Friedman Middle School, Joseph C. Chamberlain Elementary School, and Taunton High School.
Ownership History
Date
Name
Owned For
Owner Type
Purchase Details
Closed on
Sep 23, 2024
Sold by
Brillon Deena L and Brillon Shawn
Bought by
Russo Bryann
Current Estimated Value
Purchase Details
Closed on
Jan 3, 2018
Sold by
Russo Joseph A and Russo Deena L
Bought by
Brillon Deena L and Brillon Shawn
Home Financials for this Owner
Home Financials are based on the most recent Mortgage that was taken out on this home.
Original Mortgage
$280,000
Interest Rate
2.75%
Mortgage Type
Adjustable Rate Mortgage/ARM
Purchase Details
Closed on
Sep 11, 2002
Sold by
Mooney Paul A and Hollingsworth Lisa L
Bought by
Russo Joseph A and Russo Deena L
Home Financials for this Owner
Home Financials are based on the most recent Mortgage that was taken out on this home.
Original Mortgage
$236,000
Interest Rate
6.48%
Mortgage Type
Purchase Money Mortgage
Purchase Details
Closed on
Oct 3, 1996
Sold by
Genoa Inc
Bought by
Marcotte Barbara A and Leitao Suzette M
Create a Home Valuation Report for This Property
The Home Valuation Report is an in-depth analysis detailing your home's value as well as a comparison with similar homes in the area
Home Values in the Area
Average Home Value in this Area
Purchase History
| Date | Buyer | Sale Price | Title Company |
|---|---|---|---|
| Russo Bryann | -- | None Available | |
| Russo Bryann | -- | None Available | |
| Brillon Deena L | -- | -- | |
| Russo Joseph A | $295,000 | -- | |
| Marcotte Barbara A | $166,950 | -- | |
| Brillon Deena L | -- | -- | |
| Russo Joseph A | $295,000 | -- | |
| Marcotte Barbara A | $166,950 | -- |
Source: Public Records
Mortgage History
| Date | Status | Borrower | Loan Amount |
|---|---|---|---|
| Previous Owner | Brillon Deena L | $280,000 | |
| Previous Owner | Marcotte Barbara A | $236,000 |
Source: Public Records
Tax History Compared to Growth
Tax History
| Year | Tax Paid | Tax Assessment Tax Assessment Total Assessment is a certain percentage of the fair market value that is determined by local assessors to be the total taxable value of land and additions on the property. | Land | Improvement |
|---|---|---|---|---|
| 2025 | $5,744 | $525,000 | $138,900 | $386,100 |
| 2024 | $4,839 | $432,400 | $138,900 | $293,500 |
| 2023 | $4,803 | $398,600 | $145,200 | $253,400 |
| 2022 | $4,397 | $333,600 | $112,600 | $221,000 |
| 2021 | $4,416 | $311,000 | $102,300 | $208,700 |
| 2020 | $4,214 | $283,600 | $102,300 | $181,300 |
| 2019 | $4,284 | $271,800 | $102,300 | $169,500 |
| 2018 | $4,056 | $258,000 | $103,400 | $154,600 |
| 2017 | $3,849 | $245,000 | $98,000 | $147,000 |
| 2016 | $3,710 | $236,600 | $95,100 | $141,500 |
| 2015 | $3,698 | $246,400 | $95,300 | $151,100 |
| 2014 | $3,484 | $238,500 | $95,300 | $143,200 |
Source: Public Records
Map
Nearby Homes
- 1 Betsy Ross Rd
- 32 Pineview Terrace
- 48 Mayflower Ave
- 17 Puritan Rd
- 109 Broadway
- 1 Maplewood Ln Unit 33-3
- 7 Minute Man Rd
- 17 Lisa Dr
- 9 Abbey Ln
- 1 Lisa Dr
- 13 Broadway
- 5 New Carver St
- 15 Andrew Ave
- 22 Garfield St
- 68 Sabbatia Ln
- 120 Carver St
- 46 Van Buren St
- 281 Carver St
- 872 Whittenton St
- 1 Whittenton St
- 1 King Philip St
- 97 Prospect Hill St
- 2 King Philip St
- 11 Regan Cir
- 101 Prospect Hill St Unit ST
- 2 King Philip St
- 31 Regan Cir
- 20 King Philip St
- 116 Prospect Hill St
- 95 Prospect Hill St
- 103 Prospect Hill St
- 120 Prospect Hill St
- 51 Regan Cir
- 8 Regan Cir
- 20 Regan Cir
- 34 King Philip St
- 105 Prospect Hill St
- 38 Regan Cir
- 112 Prospect Hill St
- 93 Prospect Hill St