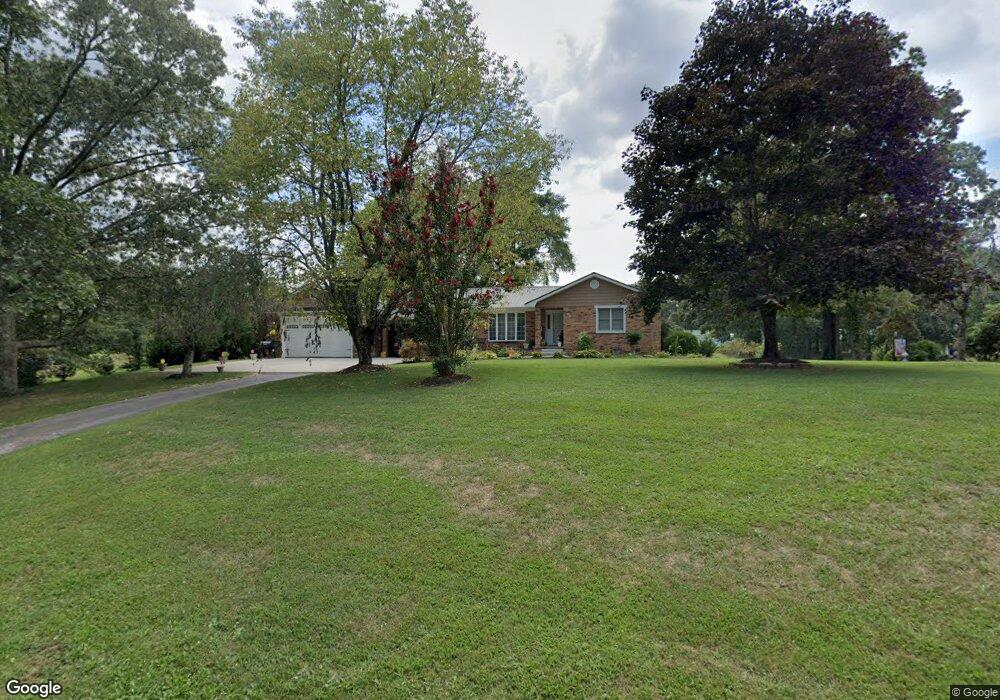
99 Short Rd Crossville, TN 38555
Estimated Value: $236,000 - $298,000
--
Bed
2
Baths
1,460
Sq Ft
$183/Sq Ft
Est. Value
About This Home
This home is located at 99 Short Rd, Crossville, TN 38555 and is currently estimated at $266,931, approximately $182 per square foot. 99 Short Rd is a home located in Cumberland County with nearby schools including Stone Elementary School, Stone Memorial High School, and Crossville Christian School.
Ownership History
Date
Name
Owned For
Owner Type
Purchase Details
Closed on
Mar 7, 2012
Sold by
Manis Daniel G
Bought by
Garrett Terry J and Garrett Sharon
Current Estimated Value
Purchase Details
Closed on
Aug 28, 2007
Sold by
Amos Donald D
Bought by
Manis Daniel G
Home Financials for this Owner
Home Financials are based on the most recent Mortgage that was taken out on this home.
Original Mortgage
$65,000
Interest Rate
6.62%
Purchase Details
Closed on
Nov 17, 2006
Sold by
Wyatt Norman Dale
Bought by
Amos Donald D
Create a Home Valuation Report for This Property
The Home Valuation Report is an in-depth analysis detailing your home's value as well as a comparison with similar homes in the area
Home Values in the Area
Average Home Value in this Area
Purchase History
| Date | Buyer | Sale Price | Title Company |
|---|---|---|---|
| Garrett Terry J | -- | -- | |
| Manis Daniel G | $141,000 | -- | |
| Amos Donald D | $100,000 | -- |
Source: Public Records
Mortgage History
| Date | Status | Borrower | Loan Amount |
|---|---|---|---|
| Previous Owner | Amos Donald D | $65,000 |
Source: Public Records
Tax History Compared to Growth
Tax History
| Year | Tax Paid | Tax Assessment Tax Assessment Total Assessment is a certain percentage of the fair market value that is determined by local assessors to be the total taxable value of land and additions on the property. | Land | Improvement |
|---|---|---|---|---|
| 2024 | $560 | $49,300 | $3,000 | $46,300 |
| 2023 | $560 | $49,300 | $0 | $0 |
| 2022 | $560 | $49,300 | $3,000 | $46,300 |
| 2021 | $455 | $29,075 | $3,000 | $26,075 |
| 2020 | $455 | $29,075 | $3,000 | $26,075 |
| 2019 | $455 | $29,075 | $3,000 | $26,075 |
| 2018 | $455 | $29,075 | $3,000 | $26,075 |
| 2017 | $455 | $29,075 | $3,000 | $26,075 |
| 2016 | $357 | $23,350 | $3,000 | $20,350 |
| 2015 | $350 | $23,350 | $3,000 | $20,350 |
| 2014 | $350 | $23,356 | $0 | $0 |
Source: Public Records
Map
Nearby Homes