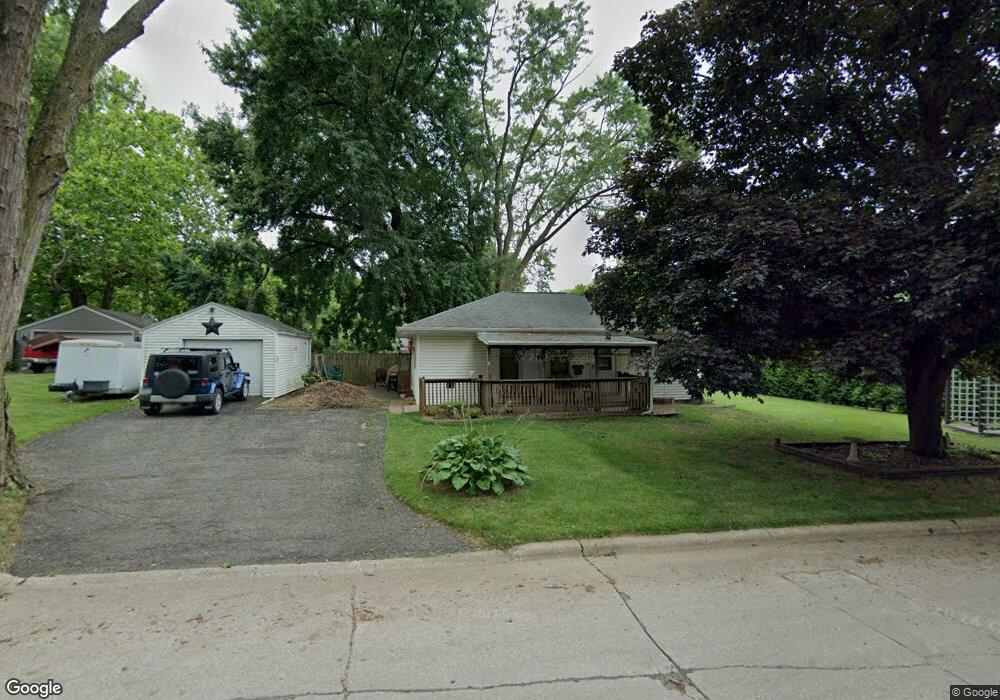
990 26th St Marion, IA 52302
Estimated Value: $122,000 - $149,000
2
Beds
1
Bath
816
Sq Ft
$166/Sq Ft
Est. Value
About This Home
This home is located at 990 26th St, Marion, IA 52302 and is currently estimated at $135,408, approximately $165 per square foot. 990 26th St is a home located in Linn County with nearby schools including Francis Marion Intermediate School, Vernon Middle School, and Marion High School.
Ownership History
Date
Name
Owned For
Owner Type
Purchase Details
Closed on
Aug 30, 2004
Sold by
Bos Trisha Lee and Bos Randy
Bought by
Trentz William A and Trentz Brenda L
Current Estimated Value
Home Financials for this Owner
Home Financials are based on the most recent Mortgage that was taken out on this home.
Original Mortgage
$77,991
Outstanding Balance
$39,205
Interest Rate
6.1%
Mortgage Type
VA
Estimated Equity
$96,203
Purchase Details
Closed on
Aug 12, 1999
Sold by
Haars Raymond W and Haars Ruth E
Bought by
Jirouch Trisha L
Home Financials for this Owner
Home Financials are based on the most recent Mortgage that was taken out on this home.
Original Mortgage
$58,900
Interest Rate
7.77%
Create a Home Valuation Report for This Property
The Home Valuation Report is an in-depth analysis detailing your home's value as well as a comparison with similar homes in the area
Home Values in the Area
Average Home Value in this Area
Purchase History
| Date | Buyer | Sale Price | Title Company |
|---|---|---|---|
| Trentz William A | $75,000 | -- | |
| Jirouch Trisha L | $61,500 | -- |
Source: Public Records
Mortgage History
| Date | Status | Borrower | Loan Amount |
|---|---|---|---|
| Open | Trentz William A | $77,991 | |
| Previous Owner | Jirouch Trisha L | $58,900 |
Source: Public Records
Tax History Compared to Growth
Tax History
| Year | Tax Paid | Tax Assessment Tax Assessment Total Assessment is a certain percentage of the fair market value that is determined by local assessors to be the total taxable value of land and additions on the property. | Land | Improvement |
|---|---|---|---|---|
| 2025 | $1,628 | $113,000 | $18,900 | $94,100 |
| 2024 | $1,636 | $105,900 | $18,900 | $87,000 |
| 2023 | $1,636 | $105,900 | $18,900 | $87,000 |
| 2022 | $1,578 | $85,800 | $18,900 | $66,900 |
| 2021 | $1,452 | $85,800 | $18,900 | $66,900 |
| 2020 | $1,452 | $76,100 | $18,900 | $57,200 |
| 2019 | $1,360 | $72,100 | $18,900 | $53,200 |
| 2018 | $1,322 | $72,100 | $18,900 | $53,200 |
| 2017 | $1,442 | $68,100 | $18,900 | $49,200 |
| 2016 | $1,442 | $68,100 | $18,900 | $49,200 |
| 2015 | $1,435 | $68,100 | $18,900 | $49,200 |
| 2014 | $1,242 | $68,100 | $18,900 | $49,200 |
| 2013 | $1,188 | $68,100 | $18,900 | $49,200 |
Source: Public Records
Map
Nearby Homes