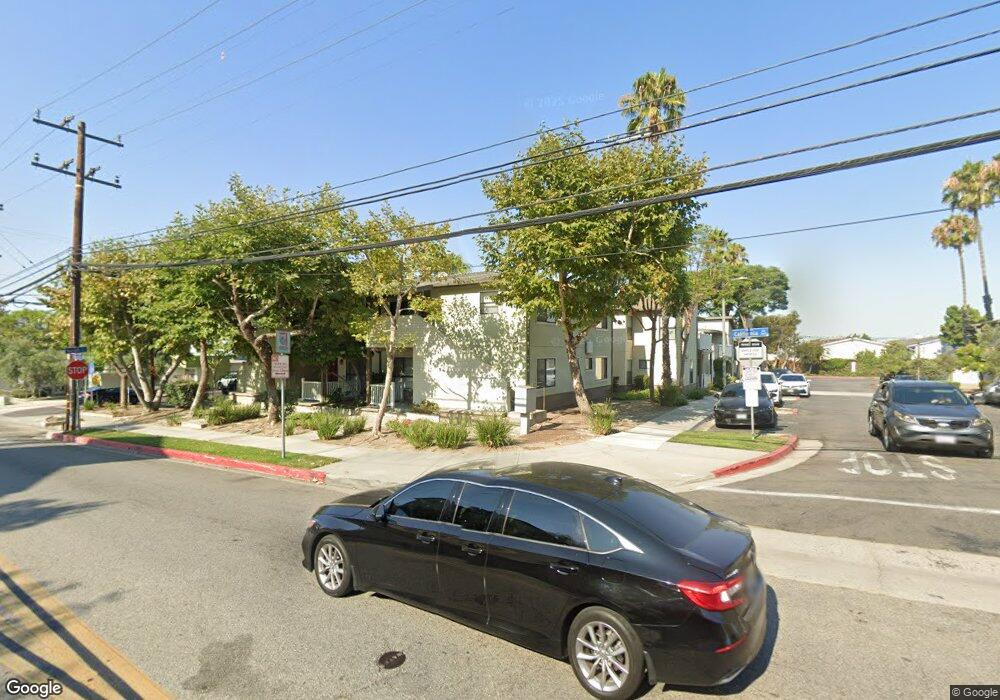
990 E Nevada St Signal Hill, CA 90755
Estimated Value: $1,294,000 - $1,594,000
12
Beds
8
Baths
4,608
Sq Ft
$327/Sq Ft
Est. Value
About This Home
This home is located at 990 E Nevada St, Signal Hill, CA 90755 and is currently estimated at $1,506,058, approximately $326 per square foot. 990 E Nevada St is a home located in Los Angeles County with nearby schools including Signal Hill Elementary School, Nelson Academy, and Long Beach Polytechnic High School.
Ownership History
Date
Name
Owned For
Owner Type
Purchase Details
Closed on
Oct 5, 1998
Sold by
Leal Maria Luisa
Bought by
Leal Arnulfo
Current Estimated Value
Home Financials for this Owner
Home Financials are based on the most recent Mortgage that was taken out on this home.
Original Mortgage
$256,000
Outstanding Balance
$64,049
Interest Rate
8.85%
Estimated Equity
$1,442,009
Purchase Details
Closed on
Sep 24, 1998
Sold by
Dem Investments Inc
Bought by
Leal Arnulfo
Home Financials for this Owner
Home Financials are based on the most recent Mortgage that was taken out on this home.
Original Mortgage
$256,000
Outstanding Balance
$64,049
Interest Rate
8.85%
Estimated Equity
$1,442,009
Purchase Details
Closed on
Sep 11, 1998
Sold by
Wilshire Funding Corp
Bought by
Dem Investments Inc
Home Financials for this Owner
Home Financials are based on the most recent Mortgage that was taken out on this home.
Original Mortgage
$256,000
Outstanding Balance
$64,049
Interest Rate
8.85%
Estimated Equity
$1,442,009
Purchase Details
Closed on
Jun 5, 1998
Sold by
Lopez Rafael Espinoza
Bought by
Wilshire Funding Corp
Purchase Details
Closed on
Jun 17, 1997
Sold by
Standard Svgs Bank
Bought by
Rodriguez Adolfo and South Central Investments
Home Financials for this Owner
Home Financials are based on the most recent Mortgage that was taken out on this home.
Original Mortgage
$305,471
Interest Rate
7.83%
Mortgage Type
FHA
Purchase Details
Closed on
Jun 12, 1997
Sold by
Rodriguez Adolfo and South Central Investments
Bought by
Lopez Rafael Espinoza
Home Financials for this Owner
Home Financials are based on the most recent Mortgage that was taken out on this home.
Original Mortgage
$305,471
Interest Rate
7.83%
Mortgage Type
FHA
Create a Home Valuation Report for This Property
The Home Valuation Report is an in-depth analysis detailing your home's value as well as a comparison with similar homes in the area
Home Values in the Area
Average Home Value in this Area
Purchase History
We collect this data history from publicly available records. To have your information removed, we recommend requesting removal directly through your county’s website.
| Date | Buyer | Sale Price | Title Company |
|---|---|---|---|
| Leal Arnulfo | -- | Fidelity National Title Co | |
| Leal Arnulfo | $320,000 | Fidelity National Title Co | |
| Dem Investments Inc | $185,000 | Benefit Land Title | |
| Wilshire Funding Corp | $175,000 | Benefit Land Title Ins Co | |
| Rodriguez Adolfo | $175,000 | Commonwealth Title | |
| Lopez Rafael Espinoza | $320,000 | Commonwealth Title |
Source: Public Records
Mortgage History
We collect this data history from publicly available records. To have your information removed, we recommend requesting removal directly through your county’s website.
| Date | Status | Borrower | Loan Amount |
|---|---|---|---|
| Open | Leal Arnulfo | $256,000 | |
| Closed | Dem Investments Inc | $200,475 | |
| Previous Owner | Lopez Rafael Espinoza | $305,471 | |
| Closed | Leal Arnulfo | $48,000 |
Source: Public Records
Tax History
| Year | Tax Paid | Tax Assessment Tax Assessment Total Assessment is a certain percentage of the fair market value that is determined by local assessors to be the total taxable value of land and additions on the property. | Land | Improvement |
|---|---|---|---|---|
| 2025 | $1,414 | $490,686 | $144,820 | $345,866 |
| 2024 | $2,853 | $481,066 | $141,981 | $339,085 |
| 2023 | $1,305 | $471,635 | $139,198 | $332,437 |
| 2022 | $1,277 | $462,388 | $136,469 | $325,919 |
| 2021 | $1,217 | $453,323 | $133,794 | $319,529 |
| 2019 | $1,212 | $439,879 | $129,827 | $310,052 |
| 2018 | $1,226 | $431,255 | $127,282 | $303,973 |
| 2017 | $6,441 | $422,800 | $124,787 | $298,013 |
| 2016 | $6,009 | $414,511 | $122,341 | $292,170 |
| 2015 | $1,216 | $408,286 | $120,504 | $287,782 |
| 2014 | $1,246 | $400,289 | $118,144 | $282,145 |
Source: Public Records
Map
Nearby Homes
- 932 E 23rd St
- 2285 Lewis Ave
- 2173 Olive Ave
- 1125 E Salt Lake St
- 1131 E 21st St
- 1204 E Smith Place
- 2337 Long Beach Blvd
- 2071 Atlantic Ave
- 2051 Orange Ave
- 223 E Eagle St
- 1211 E Leigh Ct
- 1460 E Willow St Unit 112
- 2341 Walnut Ave
- 2320 Locust Ave
- 2599 Walnut Ave Unit 205
- 201 E Eagle St
- 1972 Olive Ave
- 410 E 21st St
- 1339 E Wesley Dr
- 1941 Olive Ave
- 974 E Nevada St
- 982 E Nevada St
- 966 E Nevada St
- 958 E Nevada St
- 998 E Nevada St
- 975 E Nevada St
- 983 E Nevada St
- 839 E Sunrise Blvd
- 967 E Nevada St
- 991 E Nevada St
- 999 E Nevada St
- 831 E Sunrise Blvd
- 843 E Eagle St
- 974 Las Brisas
- 982 Las Brisas
- 966 Las Brisas
- 841 E Eagle St
- 821 E Sunrise Blvd
- 836 E Sunrise Blvd
- 990 Las Brisas
Your Personal Tour Guide
Ask me questions while you tour the home.