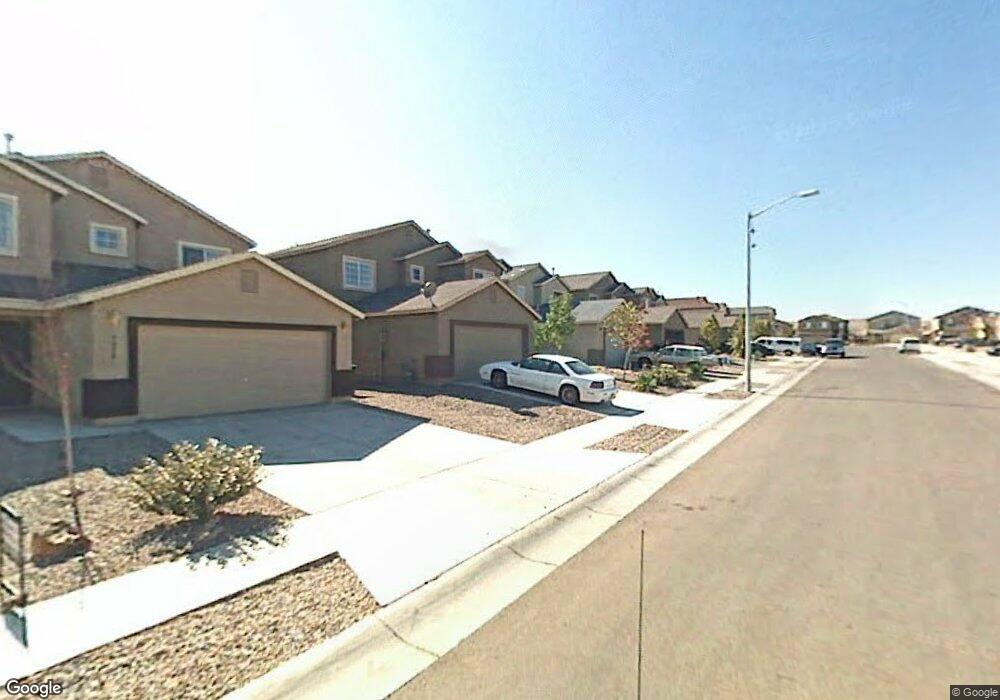
9900 Pinot Nor Ave SW Albuquerque, NM 87121
Southwest Heights NeighborhoodEstimated Value: $284,000 - $349,000
3
Beds
3
Baths
1,796
Sq Ft
$178/Sq Ft
Est. Value
About This Home
This home is located at 9900 Pinot Nor Ave SW, Albuquerque, NM 87121 and is currently estimated at $319,866, approximately $178 per square foot. 9900 Pinot Nor Ave SW is a home located in Bernalillo County with nearby schools including Rudolfo Anaya Elementary School, Tony Hillerman Middle School, and Atrisco Heritage Academy High School.
Ownership History
Date
Name
Owned For
Owner Type
Purchase Details
Closed on
Dec 22, 2021
Sold by
Tramway Properties Llc
Bought by
Rodriguez Jaggar D and Rodriguez Yosimar M
Current Estimated Value
Home Financials for this Owner
Home Financials are based on the most recent Mortgage that was taken out on this home.
Original Mortgage
$264,180
Outstanding Balance
$242,550
Interest Rate
2.98%
Mortgage Type
VA
Estimated Equity
$77,316
Purchase Details
Closed on
Sep 25, 2021
Sold by
Duc Vu Phi
Bought by
Tramway Properties Llc
Purchase Details
Closed on
Jan 4, 2006
Sold by
Longford At Arrowwood Llc
Bought by
Vu Phi Duc
Home Financials for this Owner
Home Financials are based on the most recent Mortgage that was taken out on this home.
Original Mortgage
$136,660
Interest Rate
6.75%
Mortgage Type
Purchase Money Mortgage
Create a Home Valuation Report for This Property
The Home Valuation Report is an in-depth analysis detailing your home's value as well as a comparison with similar homes in the area
Home Values in the Area
Average Home Value in this Area
Purchase History
| Date | Buyer | Sale Price | Title Company |
|---|---|---|---|
| Rodriguez Jaggar D | -- | Fidelity National Title | |
| Tramway Properties Llc | -- | Fidelity National Title | |
| Vu Phi Duc | -- | Fidelity Natl Title Ins Co |
Source: Public Records
Mortgage History
| Date | Status | Borrower | Loan Amount |
|---|---|---|---|
| Open | Rodriguez Jaggar D | $264,180 | |
| Previous Owner | Vu Phi Duc | $136,660 |
Source: Public Records
Tax History Compared to Growth
Tax History
| Year | Tax Paid | Tax Assessment Tax Assessment Total Assessment is a certain percentage of the fair market value that is determined by local assessors to be the total taxable value of land and additions on the property. | Land | Improvement |
|---|---|---|---|---|
| 2024 | $2,975 | $70,507 | $15,629 | $54,878 |
| 2023 | $2,925 | $68,454 | $15,174 | $53,280 |
| 2022 | $2,827 | $66,460 | $14,732 | $51,728 |
| 2021 | $2,214 | $52,293 | $9,750 | $42,543 |
| 2020 | $2,178 | $50,770 | $9,466 | $41,304 |
| 2019 | $2,114 | $49,291 | $9,190 | $40,101 |
| 2018 | $2,039 | $49,291 | $9,190 | $40,101 |
| 2017 | $1,976 | $47,856 | $8,923 | $38,933 |
| 2016 | $1,919 | $45,110 | $8,411 | $36,699 |
| 2015 | $43,796 | $43,796 | $8,166 | $35,630 |
| 2014 | $1,878 | $44,229 | $8,166 | $36,063 |
| 2013 | -- | $44,629 | $8,166 | $36,463 |
Source: Public Records
Map
Nearby Homes
- 9909 Shiraz Rd SW
- 10224 Cristalino Rd SW
- 9801 Sun Chaser Trail SW Unit 1
- 10040 Artemsia Ave SW
- 10039 Andrews Ave SW
- 10501 Serafina Way SW
- 2627 Sun Canyon Ln SW
- 10504 Serafina SW
- 10505 Serafina Way SW
- 10512 Valedon Ln SW
- 10508 Serafina Way SW
- 10509 Serafina Way SW
- 10512 Serafina Way SW
- 10516 Valedon Ln SW
- 10517 Serafina Way SW
- 2615 Silver Star Dr SW
- 10520 Serafina Way SW
- 9808 Morning Sun Trail SW
- 10521 Serafina Way SW
- 10519 Valedon Ln SW
- 9900 Pinot Noir Ave SW
- 9904 Pinot Nor Ave SW
- 9836 Pinot Nor Ave SW
- 9836 Pinot Noir Ave SW
- 9908 Pinot Nor Ave SW
- 9908 Pinot Noir Ave SW
- 9832 Pinot Nor Ave SW
- 9832 Pinot Noir Ave SW
- 0 Pinot Noir Ave SW Unit 607047
- 0 Pinot Noir Ave SW
- 9835 Shiraz Rd SW
- 9901 Shiraz Rd SW
- 9912 Pinot Nor Ave SW
- 9912 Pinot Noir Ave SW
- 9831 Shiraz Rd SW
- 9828 Pinot Nor Ave SW
- 9905 Shiraz Rd SW
- 9827 Shiraz Rd SW
- 9916 Pinot Nor Ave SW
- 9916 Pinot Noir Ave SW