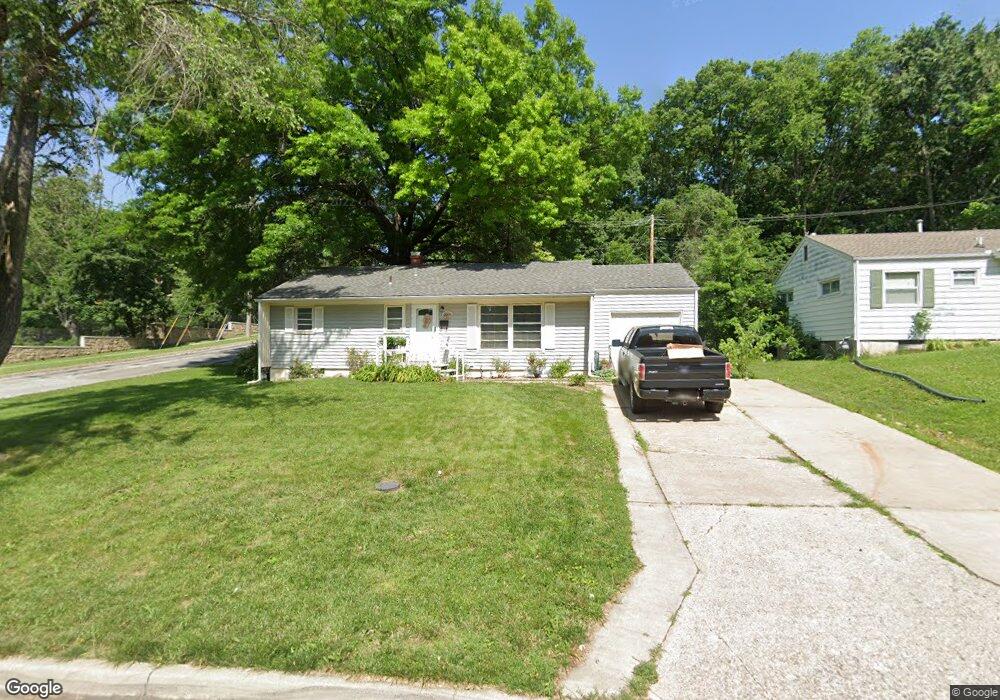
9901 Harrison St Kansas City, MO 64131
Linden Hills & Indian Heights NeighborhoodEstimated Value: $233,000 - $264,000
3
Beds
2
Baths
1,048
Sq Ft
$234/Sq Ft
Est. Value
About This Home
This home is located at 9901 Harrison St, Kansas City, MO 64131 and is currently estimated at $245,487, approximately $234 per square foot. 9901 Harrison St is a home located in Jackson County with nearby schools including Indian Creek Elementary School, Center Middle School, and Center High School.
Ownership History
Date
Name
Owned For
Owner Type
Purchase Details
Closed on
Jan 31, 2025
Sold by
Jake Zillner Inc
Bought by
Zillner Jake and Zillner Judith
Current Estimated Value
Purchase Details
Closed on
Nov 11, 2024
Sold by
Siam Manal and Wiedel Shawn
Bought by
Jake Zillner Inc
Purchase Details
Closed on
Oct 22, 2009
Sold by
Buske Jeremy D and Buske Jennifer L
Bought by
Siam Manal
Home Financials for this Owner
Home Financials are based on the most recent Mortgage that was taken out on this home.
Original Mortgage
$121,754
Interest Rate
5.14%
Mortgage Type
FHA
Purchase Details
Closed on
May 27, 2005
Sold by
Greenspeed Properties Inc
Bought by
Buske Jeremy D and Swim Jennifer L
Home Financials for this Owner
Home Financials are based on the most recent Mortgage that was taken out on this home.
Original Mortgage
$121,950
Interest Rate
5.83%
Mortgage Type
Fannie Mae Freddie Mac
Purchase Details
Closed on
Oct 13, 2004
Sold by
Smithson Patricia A and Redmond Patricia A
Bought by
Greenspeed Properties Inc
Create a Home Valuation Report for This Property
The Home Valuation Report is an in-depth analysis detailing your home's value as well as a comparison with similar homes in the area
Home Values in the Area
Average Home Value in this Area
Purchase History
| Date | Buyer | Sale Price | Title Company |
|---|---|---|---|
| Zillner Jake | -- | None Listed On Document | |
| Jake Zillner Inc | -- | Freedom Title | |
| Jake Zillner Inc | -- | Freedom Title | |
| Siam Manal | -- | Nations Title Agency Ks Inc | |
| Buske Jeremy D | -- | Kansas City Title | |
| Greenspeed Properties Inc | -- | First American Title |
Source: Public Records
Mortgage History
| Date | Status | Borrower | Loan Amount |
|---|---|---|---|
| Previous Owner | Siam Manal | $121,754 | |
| Previous Owner | Buske Jeremy D | $121,950 |
Source: Public Records
Tax History Compared to Growth
Tax History
| Year | Tax Paid | Tax Assessment Tax Assessment Total Assessment is a certain percentage of the fair market value that is determined by local assessors to be the total taxable value of land and additions on the property. | Land | Improvement |
|---|---|---|---|---|
| 2025 | $2,963 | $31,910 | $4,820 | $27,090 |
| 2024 | $2,903 | $38,374 | $4,404 | $33,970 |
| 2023 | $2,903 | $38,374 | $4,383 | $33,991 |
| 2022 | $2,103 | $24,130 | $5,419 | $18,711 |
| 2021 | $2,097 | $24,130 | $5,419 | $18,711 |
| 2020 | $2,247 | $24,165 | $5,419 | $18,746 |
| 2019 | $2,031 | $24,165 | $5,419 | $18,746 |
| 2018 | $1,986 | $21,031 | $4,716 | $16,315 |
| 2017 | $1,986 | $21,031 | $4,716 | $16,315 |
| 2016 | $1,978 | $20,504 | $3,813 | $16,691 |
| 2014 | $1,962 | $20,102 | $3,738 | $16,364 |
Source: Public Records
Map
Nearby Homes
- 9905 Campbell St
- 1101 Queens Place
- 10004 Tracy Ave
- 1222 Queens Place
- 728 E 97th St
- 10110 Forest Ave
- 10218 Tracy Ave
- 9519 Charlotte St
- 9714 Shepherds Dr
- 9505 Charlotte St
- 801 E 95th St
- 9940 Locust St
- 1830 E 97th St
- 9508 McGee St
- 9722 Walnut St
- 223 E Bannister Rd
- 12823 Kenwood Ave
- 12819 Kenwood Ave
- 12831 Kenwood Ave
- 12827 Kenwood Ave
- 9900 Harrison St
- 9905 Harrison St
- 9902 Harrison St
- 9835 Harrison Cir
- 9904 Harrison St
- 9834 Harrison Cir
- 9909 Harrison St
- 1212 E 99th St
- 9908 Harrison St
- 9911 Harrison St
- 9830 Harrison Cir
- 9912 Harrison St
- 1201 E 98th Terrace
- 1218 E 99th St
- 9901 Campbell St
- 9903 Campbell St
- 1207 E 98th Terrace
- 9915 Harrison St
- 9916 Harrison St
- 9826 Harrison Cir