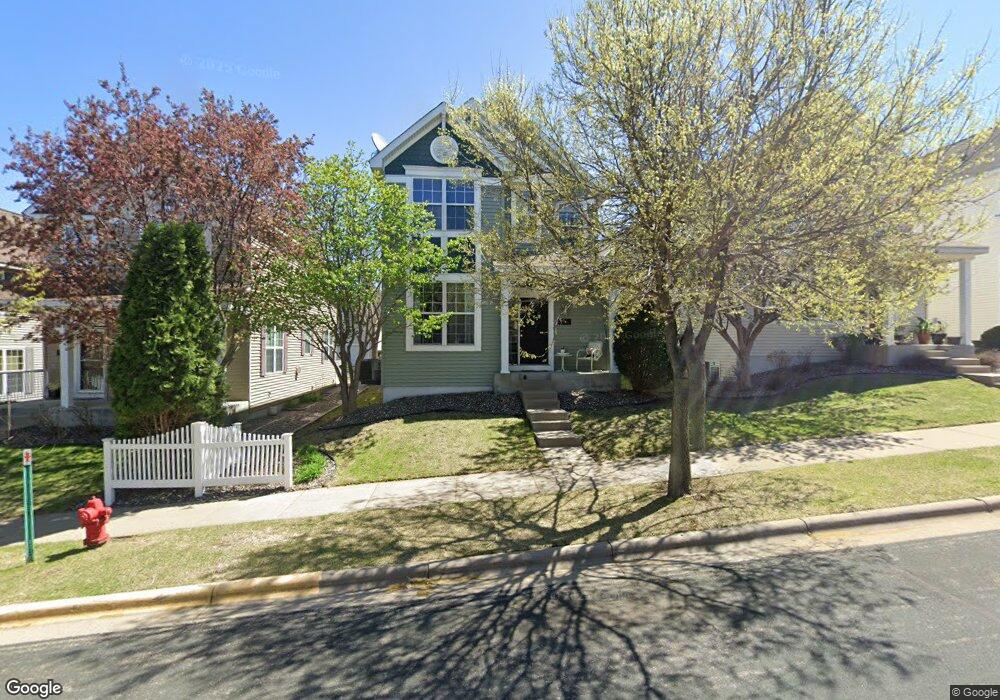
9901 Switch Grass Ln Eden Prairie, MN 55347
Estimated Value: $469,000 - $482,000
4
Beds
4
Baths
2,712
Sq Ft
$174/Sq Ft
Est. Value
About This Home
This home is located at 9901 Switch Grass Ln, Eden Prairie, MN 55347 and is currently estimated at $473,103, approximately $174 per square foot. 9901 Switch Grass Ln is a home located in Hennepin County with nearby schools including Central Middle School, Eden Prairie High School, and Primrose School of Eden Prairie.
Ownership History
Date
Name
Owned For
Owner Type
Purchase Details
Closed on
Dec 30, 2024
Sold by
Mand Paramjit S and Mand Perdip K
Bought by
Mand Paramjit S and Mand Perdip K
Current Estimated Value
Purchase Details
Closed on
Jun 11, 2010
Sold by
Borgesson Teresa Dejesus Chaib and Borgesson Fredrik
Bought by
Mand Paramjit S and Mand Perdip K
Purchase Details
Closed on
Aug 4, 2006
Sold by
The Ryland Group Inc
Bought by
Dejesus Chaib Borjesson Teresa
Purchase Details
Closed on
Mar 17, 2005
Sold by
Hennepin Village Lp
Bought by
The Ryland Group Inc
Create a Home Valuation Report for This Property
The Home Valuation Report is an in-depth analysis detailing your home's value as well as a comparison with similar homes in the area
Home Values in the Area
Average Home Value in this Area
Purchase History
| Date | Buyer | Sale Price | Title Company |
|---|---|---|---|
| Mand Paramjit S | $500 | Edgewater Title | |
| Mand Paramjit S | $500 | Edgewater Title | |
| Mand Paramjit S | $260,250 | -- | |
| Dejesus Chaib Borjesson Teresa | $357,760 | -- | |
| The Ryland Group Inc | $3,325,200 | -- |
Source: Public Records
Tax History Compared to Growth
Tax History
| Year | Tax Paid | Tax Assessment Tax Assessment Total Assessment is a certain percentage of the fair market value that is determined by local assessors to be the total taxable value of land and additions on the property. | Land | Improvement |
|---|---|---|---|---|
| 2024 | $5,531 | $462,700 | $119,100 | $343,600 |
| 2023 | $5,228 | $462,700 | $119,100 | $343,600 |
| 2022 | $4,646 | $444,400 | $126,700 | $317,700 |
| 2021 | $4,309 | $377,400 | $107,700 | $269,700 |
| 2020 | $4,456 | $352,600 | $100,700 | $251,900 |
| 2019 | $4,258 | $352,600 | $100,700 | $251,900 |
| 2018 | $4,188 | $332,600 | $95,000 | $237,600 |
| 2017 | $4,068 | $301,700 | $80,500 | $221,200 |
| 2016 | $4,040 | $301,700 | $80,500 | $221,200 |
| 2015 | $3,619 | $270,100 | $72,100 | $198,000 |
| 2014 | -- | $262,300 | $70,000 | $192,300 |
Source: Public Records
Map
Nearby Homes
- 15591 June Grass Ln
- 15579 June Grass Ln
- 15575 June Grass Ln
- 9882 Pincherry Ln
- 15729 Porchlight Ln
- 10112 Indigo Dr
- 10009 Frederick Place
- 16302 Sohm Ct
- 16326 Sohm Ct
- 9832 Rodeo Cir
- 9850 Rainier Ct
- 9716 Glacier Bay
- 9727 Sky Ln
- 10003 Dell Rd
- 16957 Valley Rd
- 9030x W Staring Ln
- 15091 Amur Hill Ln
- 9030 W Staring Ln
- 9677 Jonathan Ln
- 16597 Kenning Rd
- 9899 Switch Grass Ln
- 9903 Switch Grass Ln
- 9897 Switch Grass Ln
- 9905 Switch Grass Ln
- 9905 Switch Grass Ln
- 9905 9905 Switchgrass-Lane-
- 9895 Switch Grass Ln
- 9898 Pincherry Ln
- 9894 Pincherry Ln
- 9892 Pincherry Ln
- 9893 Switch Grass Ln
- 9900 Pincherry Ln
- 9900 Switch Grass Ln
- 9898 Switch Grass Ln
- 9902 Switch Grass Ln
- 9890 Pincherry Ln
- 9896 Switch Grass Ln
- 9904 Switch Grass Ln
- 9891 Switch Grass Ln
- 9894 Switch Grass Ln