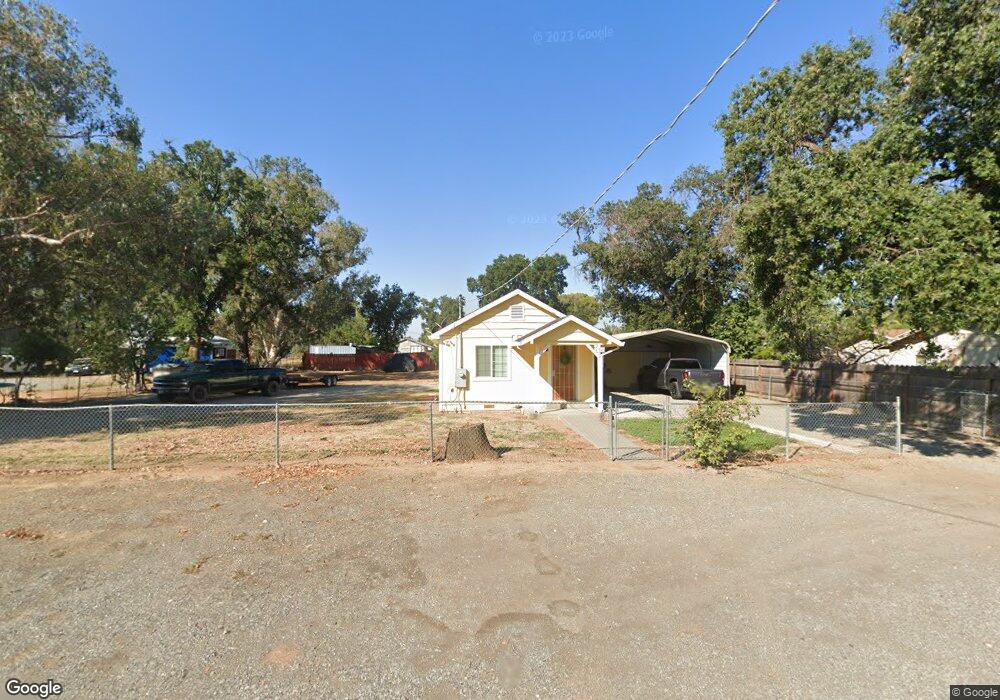
9901 Windmill St Proberta, CA 96078
Estimated Value: $125,000 - $174,832
1
Bed
1
Bath
558
Sq Ft
$269/Sq Ft
Est. Value
About This Home
This home is located at 9901 Windmill St, Proberta, CA 96078 and is currently estimated at $149,958, approximately $268 per square foot. 9901 Windmill St is a home located in Tehama County with nearby schools including Gerber Elementary School and Red Bluff High School.
Ownership History
Date
Name
Owned For
Owner Type
Purchase Details
Closed on
Jun 9, 2022
Sold by
Forge Trust Co
Bought by
Hernandez Jeanette T and Hernandez Miguel
Current Estimated Value
Home Financials for this Owner
Home Financials are based on the most recent Mortgage that was taken out on this home.
Original Mortgage
$160,550
Outstanding Balance
$152,536
Interest Rate
5.1%
Mortgage Type
New Conventional
Estimated Equity
-$2,578
Purchase Details
Closed on
Feb 21, 2013
Sold by
White Christopher A and Romo White Christina A
Bought by
Ira Services Trust Company
Purchase Details
Closed on
May 1, 2007
Sold by
Linzy Clark D and Linzy Peggy L
Bought by
White Christopher A and Romo Christina A
Home Financials for this Owner
Home Financials are based on the most recent Mortgage that was taken out on this home.
Original Mortgage
$109,000
Interest Rate
6.15%
Mortgage Type
Unknown
Create a Home Valuation Report for This Property
The Home Valuation Report is an in-depth analysis detailing your home's value as well as a comparison with similar homes in the area
Purchase History
| Date | Buyer | Sale Price | Title Company |
|---|---|---|---|
| Hernandez Jeanette T | $169,000 | Northern California Title | |
| Ira Services Trust Company | $17,000 | Northern California Title Co | |
| White Christopher A | $109,000 | Northern California Title Co |
Source: Public Records
Mortgage History
| Date | Status | Borrower | Loan Amount |
|---|---|---|---|
| Open | Hernandez Jeanette T | $160,550 | |
| Previous Owner | White Christopher A | $109,000 |
Source: Public Records
Tax History
| Year | Tax Paid | Tax Assessment Tax Assessment Total Assessment is a certain percentage of the fair market value that is determined by local assessors to be the total taxable value of land and additions on the property. | Land | Improvement |
|---|---|---|---|---|
| 2025 | $1,816 | $179,343 | $47,754 | $131,589 |
| 2023 | $1,791 | $172,380 | $45,900 | $126,480 |
| 2022 | $305 | $29,003 | $11,600 | $17,403 |
| 2021 | $300 | $28,435 | $11,373 | $17,062 |
| 2020 | $300 | $28,145 | $11,257 | $16,888 |
| 2019 | $298 | $27,594 | $11,037 | $16,557 |
| 2018 | $285 | $27,054 | $10,821 | $16,233 |
| 2017 | $287 | $26,524 | $10,609 | $15,915 |
| 2016 | $269 | $26,004 | $10,401 | $15,603 |
| 2015 | -- | $25,614 | $10,245 | $15,369 |
| 2014 | $261 | $25,113 | $10,045 | $15,068 |
Source: Public Records
Map
Nearby Homes
- 23051 Kilkenny Ln
- 23632 Campo Rd
- 9286 San Benito Ave
- 606 Ventura Ave
- 0 Reno Ave
- 406 Santa Maria Ave
- 22590 Rodeo Ave
- 23360 Russell Ave
- 0 Manor Ln
- 11425 Reading Rd
- 25040 63rd Ave
- 0 Rawson Rd Unit SN25233384
- 0 Rawson Rd Unit 14944890
- 21745 Hatfield Rd
- 25205 5th Ave
- 11705 Parey Ave
- 11705 Parey Ave Unit 39
- 11705 Parey Ave Unit 13
- 11705 Parey Ave Unit 43
- 11705 Parey Ave Unit 19
- 23135 Kindlespire Rd
- 23229 3rd St
- 9891 Windmill St
- 9854 Ashurst St
- 9875 Ashurst St
- 9841 Ashurst St
- 9865 Ashurst St
- 23202 Kindlespire Rd
- 23115 Kindlespire Rd
- 9955 Ashurst St
- 9921 Windmill St
- 9945 Windmill St
- 9913 Windmill St
- 9904 Ashurst St
- 9903 Ashurst St
- 23179 Flores Ave
- 9898 Ashurst St
- 9889 Ashurst St
- 9885 Ashurst St
- 23225 Kindlespire Rd
Your Personal Tour Guide
Ask me questions while you tour the home.