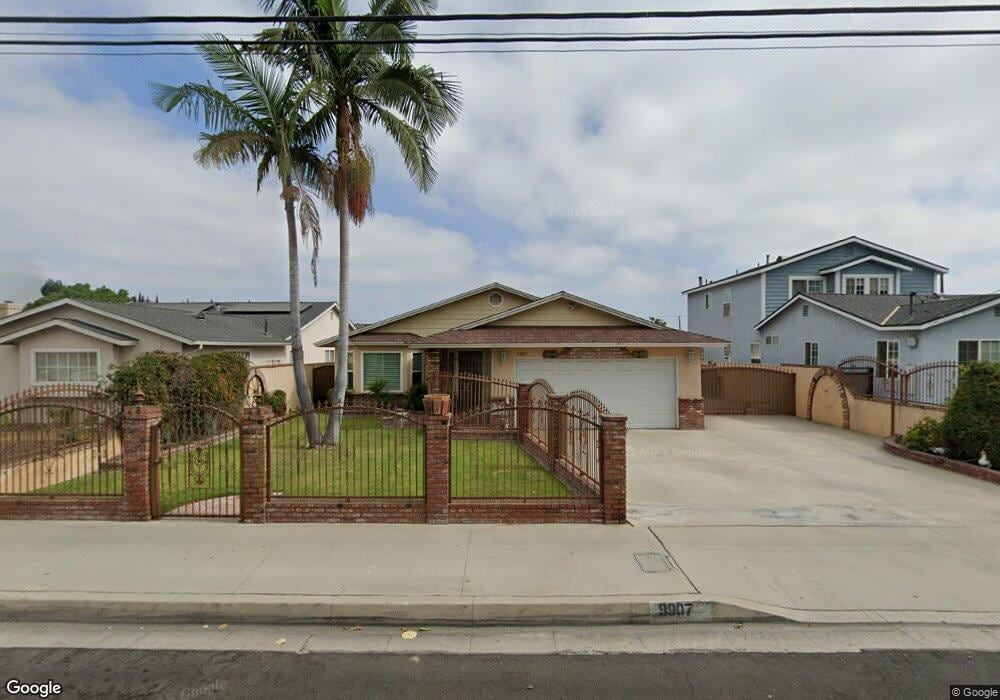
9907 Rose St Bellflower, CA 90706
Estimated Value: $1,097,000 - $1,201,000
3
Beds
2
Baths
2,327
Sq Ft
$495/Sq Ft
Est. Value
About This Home
This home is located at 9907 Rose St, Bellflower, CA 90706 and is currently estimated at $1,151,411, approximately $494 per square foot. 9907 Rose St is a home located in Los Angeles County with nearby schools including Thomas Jefferson Elementary School, Mayfair High School, and St. Bernard School.
Ownership History
Date
Name
Owned For
Owner Type
Purchase Details
Closed on
Oct 16, 2019
Sold by
Evans Morgan Sevgi and Morgan And Evans Morgan Family
Bought by
Miramontes Jaime and Miramontes Nadia
Current Estimated Value
Home Financials for this Owner
Home Financials are based on the most recent Mortgage that was taken out on this home.
Original Mortgage
$722,475
Outstanding Balance
$632,924
Interest Rate
3.5%
Estimated Equity
$518,487
Purchase Details
Closed on
Jul 4, 2001
Sold by
Morgan Joseph Roger and Evans Morgan Sevgi
Bought by
Morgan Joseph Roger
Purchase Details
Closed on
Sep 28, 2000
Sold by
Morgan Joseph R
Bought by
Morgan Joseph R and Joseph R Morgan Jr Separate Property Tr
Purchase Details
Closed on
Jul 15, 1994
Sold by
Laporte Richer and Laporte Eugenie R
Bought by
Morgan Joseph R
Create a Home Valuation Report for This Property
The Home Valuation Report is an in-depth analysis detailing your home's value as well as a comparison with similar homes in the area
Home Values in the Area
Average Home Value in this Area
Purchase History
| Date | Buyer | Sale Price | Title Company |
|---|---|---|---|
| Miramontes Jaime | $760,500 | Usa National Title Company | |
| Morgan Joseph Roger | -- | -- | |
| Morgan Joseph R | -- | -- | |
| Morgan Joseph R | $260,000 | Progressive Title Company |
Source: Public Records
Mortgage History
| Date | Status | Borrower | Loan Amount |
|---|---|---|---|
| Open | Miramontes Jaime | $722,475 |
Source: Public Records
Tax History Compared to Growth
Tax History
| Year | Tax Paid | Tax Assessment Tax Assessment Total Assessment is a certain percentage of the fair market value that is determined by local assessors to be the total taxable value of land and additions on the property. | Land | Improvement |
|---|---|---|---|---|
| 2025 | $9,934 | $831,715 | $551,415 | $280,300 |
| 2024 | $9,934 | $815,407 | $540,603 | $274,804 |
| 2023 | $9,533 | $799,419 | $530,003 | $269,416 |
| 2022 | $9,364 | $783,745 | $519,611 | $264,134 |
| 2021 | $9,172 | $768,378 | $509,423 | $258,955 |
| 2020 | $9,090 | $760,500 | $504,200 | $256,300 |
| 2019 | $5,366 | $427,752 | $195,739 | $232,013 |
| 2018 | $5,050 | $419,365 | $191,901 | $227,464 |
| 2016 | $4,832 | $403,082 | $184,450 | $218,632 |
| 2015 | $4,732 | $397,028 | $181,680 | $215,348 |
| 2014 | $4,671 | $389,252 | $178,122 | $211,130 |
Source: Public Records
Map
Nearby Homes
- 9924 Cedar St
- 9928 Cedar St
- 5549 Ashworth St
- 6168 Briercrest Ave
- 9713 Cedar St
- 6127 Adenmoor Ave
- 6118 Amos Ave
- 10240 Artesia Blvd
- 17625 Carpintero Ave Unit 62
- 9833 Palm St
- 6157 Carpintero Ave
- 10117 Palm St
- 17641 Windward Terrace
- 9513 Cedar St
- 9929 Park St
- 17715 Canehill Ave
- 5857 Eastbrook Ave
- 5134 Ashworth St
- 9833 Walnut St
- 17794 Palo Verde Ave
- 9911 Rose St
- 9901 Rose St
- 9903 Rose St
- 9915 Rose St
- 9865 Rose St
- 9914 1/2 Cedar St
- 9867 Rose St
- 9914 3/4 Cedar St
- 9914 Cedar St
- 9912 Cedar St
- 9912 3/4 Cedar St
- 9912 1/2 Cedar St
- 9922 Cedar St
- 9922 1/2 Cedar St
- 9857 Rose St
- 9910 Cedar St Unit 1/4
- 9910 Cedar St
- 9910 1/4 Cedar St
- 9910 1/2 Cedar St
- 9910 3/4 Cedar St