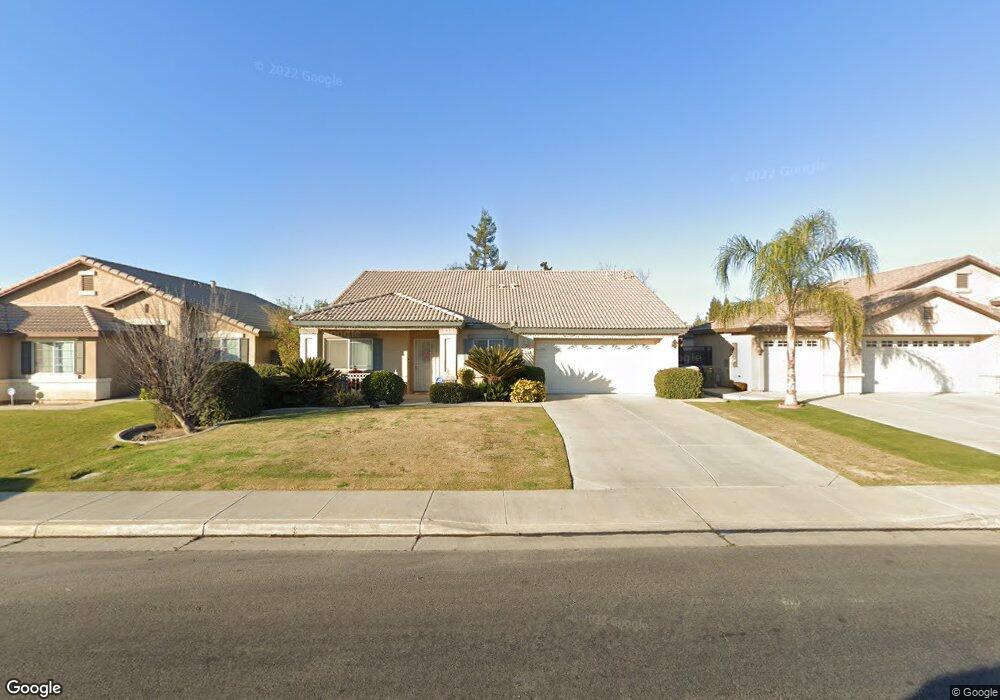
9908 Grand View Summit Dr Unit 4 Bakersfield, CA 93311
Southern Oaks NeighborhoodEstimated Value: $420,826 - $427,000
4
Beds
2
Baths
1,830
Sq Ft
$232/Sq Ft
Est. Value
About This Home
This home is located at 9908 Grand View Summit Dr Unit 4, Bakersfield, CA 93311 and is currently estimated at $423,707, approximately $231 per square foot. 9908 Grand View Summit Dr Unit 4 is a home located in Kern County with nearby schools including Old River Elementary School, Earl Warren Junior High School, and Stockdale High School.
Ownership History
Date
Name
Owned For
Owner Type
Purchase Details
Closed on
May 22, 2012
Sold by
Coston Annie Fay and Coston Annie F
Bought by
Coston Annie Fay
Current Estimated Value
Home Financials for this Owner
Home Financials are based on the most recent Mortgage that was taken out on this home.
Original Mortgage
$155,200
Outstanding Balance
$107,328
Interest Rate
3.86%
Mortgage Type
New Conventional
Estimated Equity
$316,379
Purchase Details
Closed on
Jun 4, 2004
Sold by
Lennar Bakersfield Inc
Bought by
Coston Annie F
Home Financials for this Owner
Home Financials are based on the most recent Mortgage that was taken out on this home.
Original Mortgage
$166,150
Interest Rate
6.09%
Mortgage Type
Purchase Money Mortgage
Create a Home Valuation Report for This Property
The Home Valuation Report is an in-depth analysis detailing your home's value as well as a comparison with similar homes in the area
Home Values in the Area
Average Home Value in this Area
Purchase History
| Date | Buyer | Sale Price | Title Company |
|---|---|---|---|
| Coston Annie Fay | -- | None Available | |
| Coston Annie F | $195,500 | Fidelity Title |
Source: Public Records
Mortgage History
| Date | Status | Borrower | Loan Amount |
|---|---|---|---|
| Open | Coston Annie Fay | $155,200 | |
| Closed | Coston Annie F | $166,150 |
Source: Public Records
Tax History Compared to Growth
Tax History
| Year | Tax Paid | Tax Assessment Tax Assessment Total Assessment is a certain percentage of the fair market value that is determined by local assessors to be the total taxable value of land and additions on the property. | Land | Improvement |
|---|---|---|---|---|
| 2025 | $4,000 | $277,797 | $85,298 | $192,499 |
| 2024 | $3,943 | $272,351 | $83,626 | $188,725 |
| 2023 | $3,943 | $267,012 | $81,987 | $185,025 |
| 2022 | $3,788 | $261,778 | $80,380 | $181,398 |
| 2021 | $3,703 | $256,646 | $78,804 | $177,842 |
| 2020 | $3,839 | $254,015 | $77,996 | $176,019 |
| 2019 | $3,774 | $254,015 | $77,996 | $176,019 |
| 2018 | $3,615 | $244,153 | $74,968 | $169,185 |
| 2017 | $3,600 | $239,367 | $73,499 | $165,868 |
| 2016 | $3,408 | $234,674 | $72,058 | $162,616 |
| 2015 | $3,258 | $220,000 | $55,000 | $165,000 |
| 2014 | $3,086 | $212,000 | $53,000 | $159,000 |
Source: Public Records
Map
Nearby Homes
- 9813 Fitzgerald Dr
- 10126 Pyramid Peak Dr Unit 5
- 9608 Lacroix Ct
- 4300 Keyes Ct
- 4400 Cron Way
- 10015 Saint Albans Ave
- 9918 Casa Del Sol Dr
- 10113 Saint Albans Ave
- 10016 Cobblestone Ave
- 9408 Nickam Ct
- 9609 Salinger St
- 9907 Cobblestone Ave Unit 3
- 9704 Gold Dust Dr
- 9902 Rancho Verde Dr
- 9320 Cadbury Dr
- 3912 Cornerstone Way
- 4008 Desert Springs Way
- 9209 Campus Park Ct
- 10214 Pepperwood Dr
- 10213 Single Oak Dr
- 9912 Grand View Summit Dr
- 9904 Grand View Summit Dr
- 9916 Grand View Summit Dr Unit 4
- 9905 Lightner Way
- 9900 Grand View Summit Dr Unit 4
- 9901 Lightner Way
- 9909 Lightner Way
- 9920 Grand View Summit Dr Unit 4
- 9909 Grand View Summit Dr
- 9905 Grand View Summit Dr Unit 4
- 9913 Grand View Summit Dr
- 9901 Grand View Summit Dr Unit 4
- 9811 Lightner Way
- 9913 Lightner Way
- 9924 Grand View Summit Dr Unit 4
- 9917 Grand View Summit Dr
- 4500 Spruce Mountain Way
- 9925 Grand View Summit Dr Unit 4
- 4504 Spruce Mountain Way
- 9807 Lightner Way