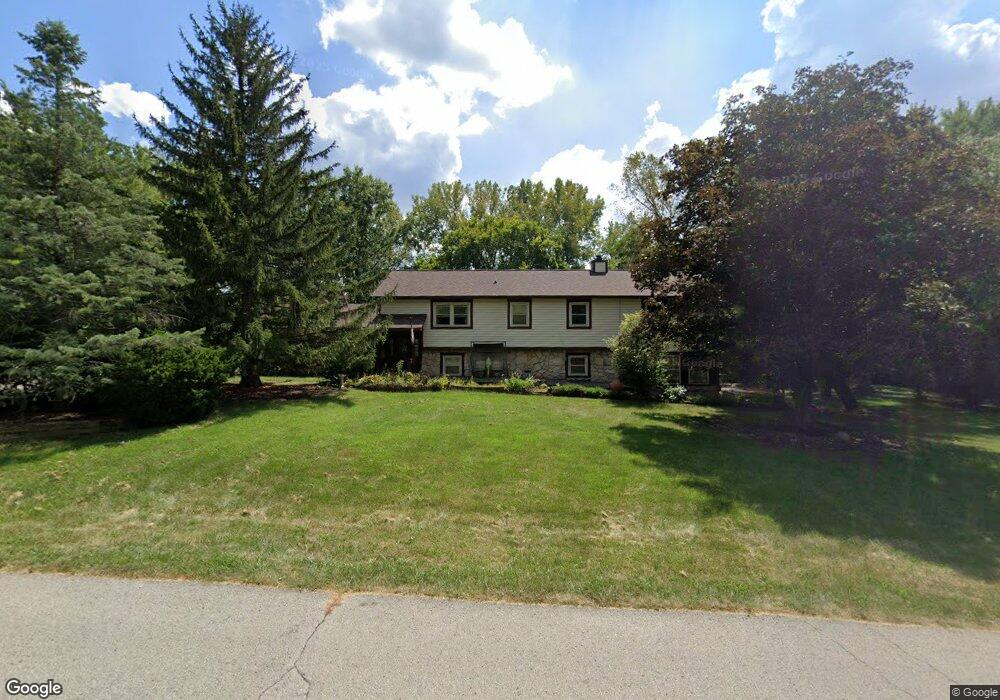
9909 Cumberland Ridge Ln Fishers, IN 46037
Estimated Value: $468,000 - $562,000
3
Beds
3
Baths
3,196
Sq Ft
$163/Sq Ft
Est. Value
About This Home
This home is located at 9909 Cumberland Ridge Ln, Fishers, IN 46037 and is currently estimated at $521,280, approximately $163 per square foot. 9909 Cumberland Ridge Ln is a home located in Hamilton County with nearby schools including Sigourney Elementary School, Lantern Road Elementary School, and Riverside Junior High School.
Ownership History
Date
Name
Owned For
Owner Type
Purchase Details
Closed on
Jan 23, 2017
Sold by
Vandevander Fred A and Vandevander Rebecca W
Bought by
Vandevander Fred A
Current Estimated Value
Home Financials for this Owner
Home Financials are based on the most recent Mortgage that was taken out on this home.
Original Mortgage
$261,561
Interest Rate
2.87%
Mortgage Type
VA
Purchase Details
Closed on
Dec 31, 2003
Sold by
Vandevander Fred A and Vandevander Rebecca W
Bought by
Vandevander Fred A and Vandevander Rebecca W
Home Financials for this Owner
Home Financials are based on the most recent Mortgage that was taken out on this home.
Original Mortgage
$174,100
Interest Rate
3.87%
Mortgage Type
Stand Alone Refi Refinance Of Original Loan
Purchase Details
Closed on
Oct 19, 2001
Sold by
Vandevander Fred A and Vandevander Rebecca W
Bought by
Vandevander Fred A and Vandevander Rebecca W
Create a Home Valuation Report for This Property
The Home Valuation Report is an in-depth analysis detailing your home's value as well as a comparison with similar homes in the area
Home Values in the Area
Average Home Value in this Area
Purchase History
| Date | Buyer | Sale Price | Title Company |
|---|---|---|---|
| Vandevander Fred A | -- | None Available | |
| Vandevander Fred A | -- | -- | |
| Vandevander Fred A | -- | -- |
Source: Public Records
Mortgage History
| Date | Status | Borrower | Loan Amount |
|---|---|---|---|
| Closed | Vandevander Fred A | $261,561 | |
| Closed | Vandevander Fred A | $174,100 |
Source: Public Records
Tax History Compared to Growth
Tax History
| Year | Tax Paid | Tax Assessment Tax Assessment Total Assessment is a certain percentage of the fair market value that is determined by local assessors to be the total taxable value of land and additions on the property. | Land | Improvement |
|---|---|---|---|---|
| 2024 | $3,901 | $400,500 | $66,100 | $334,400 |
| 2023 | $3,901 | $413,200 | $66,100 | $347,100 |
| 2022 | $3,842 | $365,800 | $66,100 | $299,700 |
| 2021 | $3,500 | $335,100 | $66,100 | $269,000 |
| 2020 | $3,063 | $293,100 | $66,100 | $227,000 |
| 2019 | $2,671 | $259,600 | $66,100 | $193,500 |
| 2018 | $2,912 | $266,400 | $66,100 | $200,300 |
| 2017 | $2,791 | $264,300 | $66,100 | $198,200 |
| 2016 | $2,803 | $266,200 | $66,100 | $200,100 |
| 2014 | $2,564 | $262,300 | $66,100 | $196,200 |
| 2013 | $2,564 | $267,400 | $66,200 | $201,200 |
Source: Public Records
Map
Nearby Homes
- 9972 Woods Edge Dr
- 10272 Whitetail Cir
- 10747 Red Pine Dr
- 10661 Burning Ridge Ln
- 10026 Parkway Dr
- 10515 Collingswood Rd
- 10334 Hillsborough Dr
- 9259 Oak Knoll Ln
- 10518 Greenway Dr
- 10244 Red Tail Dr
- 10132 Lauren Pass
- 10384 Glenn Abbey Ln
- 9237 Crossing Dr
- 9275 Muir Ln
- 10019 Niagara Dr
- 9627 Summerton Dr
- 9233 Muir Ln
- 10737 Springston Ct
- 10290 Glenn Abbey Ln
- 10655 Eric Ct
- 9915 Cumberland Ridge Ln
- 9982 Woods Edge Dr
- 9903 Cumberland Ridge Ln
- 10014 Woods Edge Dr
- 9952 Woods Edge Dr
- 9910 Cumberland Ridge Ln
- 9904 Cumberland Ridge Ln
- 10024 Woods Edge Dr
- 9932 Woods Edge Dr
- 9813 Cumberland Ridge Ln
- 9953 Woods Edge Dr
- 9921 Cumberland Ridge Ln
- 9983 Woods Edge Dr
- 10044 Woods Edge Dr
- 9916 Cumberland Ridge Ln
- 10409 Cumberland Ridge Ct
- 9912 Woods Edge Dr
- 9808 Cumberland Ridge Ct
- 10029 Glenhaven Ct
- 10074 Woods Edge Dr