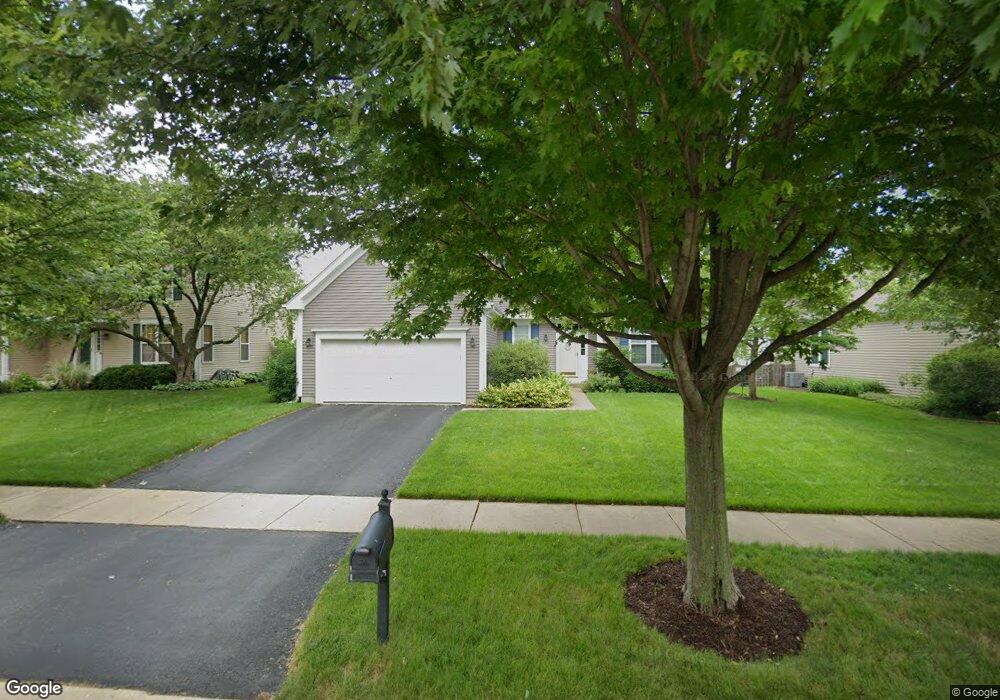
991 Amaranth Dr Aurora, IL 60504
Far East NeighborhoodEstimated Value: $481,000 - $551,850
3
Beds
3
Baths
2,122
Sq Ft
$248/Sq Ft
Est. Value
About This Home
This home is located at 991 Amaranth Dr, Aurora, IL 60504 and is currently estimated at $525,963, approximately $247 per square foot. 991 Amaranth Dr is a home located in DuPage County with nearby schools including Owen Elementary School, Mill Street Elementary School, and Waubonsie Valley High School.
Ownership History
Date
Name
Owned For
Owner Type
Purchase Details
Closed on
Jun 1, 2001
Sold by
Schendell Alex and Schendell Debra
Bought by
Johnson Ian C and Marciniak Michelle M
Current Estimated Value
Home Financials for this Owner
Home Financials are based on the most recent Mortgage that was taken out on this home.
Original Mortgage
$197,600
Interest Rate
7.03%
Purchase Details
Closed on
May 30, 2000
Sold by
Watson Kevin T and Watson Cynthia R
Bought by
Schendell Alex and Schendell Debra
Home Financials for this Owner
Home Financials are based on the most recent Mortgage that was taken out on this home.
Original Mortgage
$175,000
Interest Rate
7.75%
Purchase Details
Closed on
Jan 21, 1998
Sold by
Wiseman Hughes Enterprises Inc
Bought by
Watson Kevin T and Watson Cynthia R
Home Financials for this Owner
Home Financials are based on the most recent Mortgage that was taken out on this home.
Original Mortgage
$168,050
Interest Rate
7.24%
Create a Home Valuation Report for This Property
The Home Valuation Report is an in-depth analysis detailing your home's value as well as a comparison with similar homes in the area
Home Values in the Area
Average Home Value in this Area
Purchase History
| Date | Buyer | Sale Price | Title Company |
|---|---|---|---|
| Johnson Ian C | $247,000 | -- | |
| Schendell Alex | $225,500 | Stewart Title Company | |
| Watson Kevin T | $187,000 | -- |
Source: Public Records
Mortgage History
| Date | Status | Borrower | Loan Amount |
|---|---|---|---|
| Previous Owner | Johnson Ian C | $197,600 | |
| Previous Owner | Schendell Alex | $175,000 | |
| Previous Owner | Watson Kevin T | $168,050 |
Source: Public Records
Tax History Compared to Growth
Tax History
| Year | Tax Paid | Tax Assessment Tax Assessment Total Assessment is a certain percentage of the fair market value that is determined by local assessors to be the total taxable value of land and additions on the property. | Land | Improvement |
|---|---|---|---|---|
| 2024 | $11,017 | $152,890 | $32,463 | $120,427 |
| 2023 | $10,515 | $137,380 | $29,170 | $108,210 |
| 2022 | $10,136 | $126,870 | $26,710 | $100,160 |
| 2021 | $9,870 | $122,350 | $25,760 | $96,590 |
| 2020 | $9,991 | $122,350 | $25,760 | $96,590 |
| 2019 | $9,642 | $116,370 | $24,500 | $91,870 |
| 2018 | $9,465 | $113,160 | $23,620 | $89,540 |
| 2017 | $9,309 | $109,320 | $22,820 | $86,500 |
| 2016 | $9,146 | $104,910 | $21,900 | $83,010 |
| 2015 | $9,055 | $99,610 | $20,790 | $78,820 |
| 2014 | $8,140 | $91,780 | $19,040 | $72,740 |
| 2013 | $8,055 | $92,410 | $19,170 | $73,240 |
Source: Public Records
Map
Nearby Homes
- 4105 Winslow Ct
- 4515 Chelsea Manor Cir
- 4511 Chelsea Manor Cir
- Danbury II Plan at Chelsea Manor - Charlestown Series
- Ainslie Plan at Chelsea Manor - Charlestown Series
- 1348 Amaranth Dr
- 4118 Calder Ln
- 4138 Irving Rd
- 4177 Irving Rd
- 4328 Chelsea Manor Cir
- 3437 Charlemaine Dr
- 3901 White Eagle Dr W
- 3467 Charlemaine Dr
- 3479 Charlemaine Dr
- 4258 Stableford Ln
- 3473 Ravinia Cir
- 4284 Stableford Ln
- 1512 Harbour Towne Place
- 3389 Ravinia Cir
- 300 Churchill Ln
- 981 Amaranth Dr
- 1001 Amaranth Dr Unit 2
- 1004 Red Clover Dr
- 994 Red Clover Dr
- 971 Amaranth Dr
- 1011 Amaranth Dr
- 1014 Red Clover Dr
- 990 Amaranth Dr
- 1000 Amaranth Dr
- 984 Red Clover Dr
- 1024 Red Clover Dr
- 980 Amaranth Dr
- 961 Amaranth Dr Unit 2
- 1010 Amaranth Dr
- 970 Amaranth Dr
- 1021 Amaranth Dr
- 974 Red Clover Dr
- 1020 Amaranth Dr Unit 2
- 1034 Red Clover Dr
- 960 Amaranth Dr