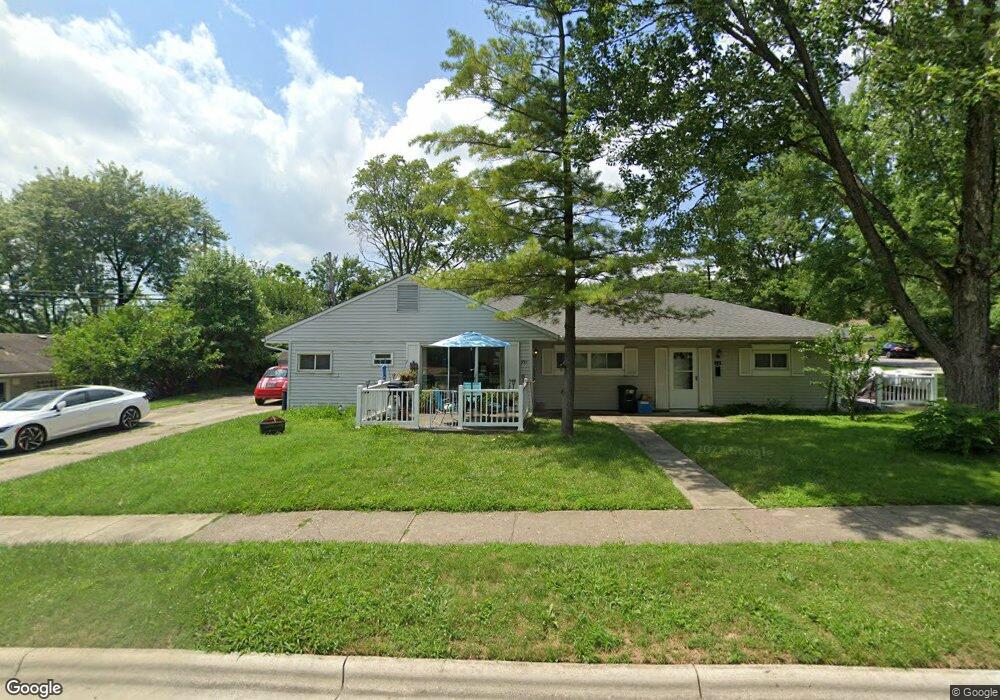
991 Kramer Ave Unit 993 Columbus, OH 43212
Estimated Value: $377,000 - $426,000
4
Beds
2
Baths
1,600
Sq Ft
$250/Sq Ft
Est. Value
About This Home
This home is located at 991 Kramer Ave Unit 993, Columbus, OH 43212 and is currently estimated at $399,406, approximately $249 per square foot. 991 Kramer Ave Unit 993 is a home located in Franklin County with nearby schools including Robert Louis Stevenson Elementary School, Larson Middle School, and Grandview Heights High School.
Ownership History
Date
Name
Owned For
Owner Type
Purchase Details
Closed on
Jun 30, 2008
Sold by
Feldman Barnet and Feldman Barnett
Bought by
Buckone Ltd
Current Estimated Value
Home Financials for this Owner
Home Financials are based on the most recent Mortgage that was taken out on this home.
Original Mortgage
$150,280
Outstanding Balance
$96,852
Interest Rate
6.05%
Mortgage Type
Purchase Money Mortgage
Estimated Equity
$302,554
Purchase Details
Closed on
Jun 30, 2004
Sold by
Brace Properties Llc
Bought by
Feldman Barnet
Purchase Details
Closed on
Jun 9, 2000
Sold by
Krumm Sarah S
Bought by
Brace Properties Llc
Home Financials for this Owner
Home Financials are based on the most recent Mortgage that was taken out on this home.
Original Mortgage
$96,000
Interest Rate
8.31%
Purchase Details
Closed on
Mar 15, 1988
Bought by
Krumm Sarah S
Purchase Details
Closed on
Jul 1, 1984
Purchase Details
Closed on
Jun 1, 1983
Create a Home Valuation Report for This Property
The Home Valuation Report is an in-depth analysis detailing your home's value as well as a comparison with similar homes in the area
Home Values in the Area
Average Home Value in this Area
Purchase History
| Date | Buyer | Sale Price | Title Company |
|---|---|---|---|
| Buckone Ltd | $149,900 | Hummel | |
| Feldman Barnet | $167,000 | Title First | |
| Brace Properties Llc | $120,000 | Lawyers Title | |
| Krumm Sarah S | $72,000 | -- | |
| -- | $71,100 | -- | |
| -- | -- | -- |
Source: Public Records
Mortgage History
| Date | Status | Borrower | Loan Amount |
|---|---|---|---|
| Open | Buckone Ltd | $150,280 | |
| Previous Owner | Brace Properties Llc | $96,000 |
Source: Public Records
Tax History Compared to Growth
Tax History
| Year | Tax Paid | Tax Assessment Tax Assessment Total Assessment is a certain percentage of the fair market value that is determined by local assessors to be the total taxable value of land and additions on the property. | Land | Improvement |
|---|---|---|---|---|
| 2024 | $5,429 | $91,390 | $42,250 | $49,140 |
| 2023 | $4,767 | $91,385 | $42,245 | $49,140 |
| 2022 | $4,683 | $76,440 | $48,440 | $28,000 |
| 2021 | $4,391 | $76,440 | $48,440 | $28,000 |
| 2020 | $4,373 | $76,440 | $48,440 | $28,000 |
| 2019 | $4,118 | $63,700 | $48,440 | $15,260 |
| 2018 | $4,039 | $63,700 | $48,440 | $15,260 |
| 2017 | $3,850 | $63,700 | $48,440 | $15,260 |
| 2016 | $3,972 | $56,220 | $29,160 | $27,060 |
| 2015 | $3,972 | $56,220 | $29,160 | $27,060 |
| 2014 | $3,984 | $56,220 | $29,160 | $27,060 |
| 2013 | $1,754 | $51,100 | $26,495 | $24,605 |
Source: Public Records
Map
Nearby Homes
- 945 Quay Ave Unit 945E
- 945 Quay Ave Unit G
- 932 Mcclain Rd
- 1451 W 2nd Ave
- 1225 Eastview Ave
- 1081 W 3rd Ave
- 943 Timberman Rd
- 1280 Broadview Ave
- 1240 Oxley Rd
- 1242 Oxley Rd
- 1083 W 3rd Ave
- 1095 W 3rd Ave
- 1093 W 3rd Ave
- 1475 W 3rd Ave Unit 204
- 1000 Urlin Ave Unit 1607
- 1000 Urlin Ave Unit 511
- 1000 Urlin Ave Unit 917
- 1000 Urlin Ave Unit 516
- 1000 Urlin Ave Unit 1007
- 1000 Urlin Ave Unit 2002
- 991 Kramer Ave Unit 991-993
- 991-993 Kramer Ave
- 1341 Bluff Ave Unit 343
- 981 Kramer Ave Unit 983
- 981-983 Kramer Ave
- 1349B Bluff Ave
- 1349A Bluff Ave
- 1349 Bluff Ave Unit A
- 1349 Bluff Ave Unit B
- 1349 Bluff Ave
- 1347 Bluff Ave Unit 51347
- 1347 Bluff Ave Unit B
- 990 Kramer Ave Unit 992
- 990-992 Kramer Ave
- 1351 Bluff Ave Unit A
- 1353 Bluff Ave
- 1353 Bluff Ave Unit B
- 1353 Bluff Ave Unit A
- 973 Kramer Ave Unit 975
- 1355 Bluff Ave