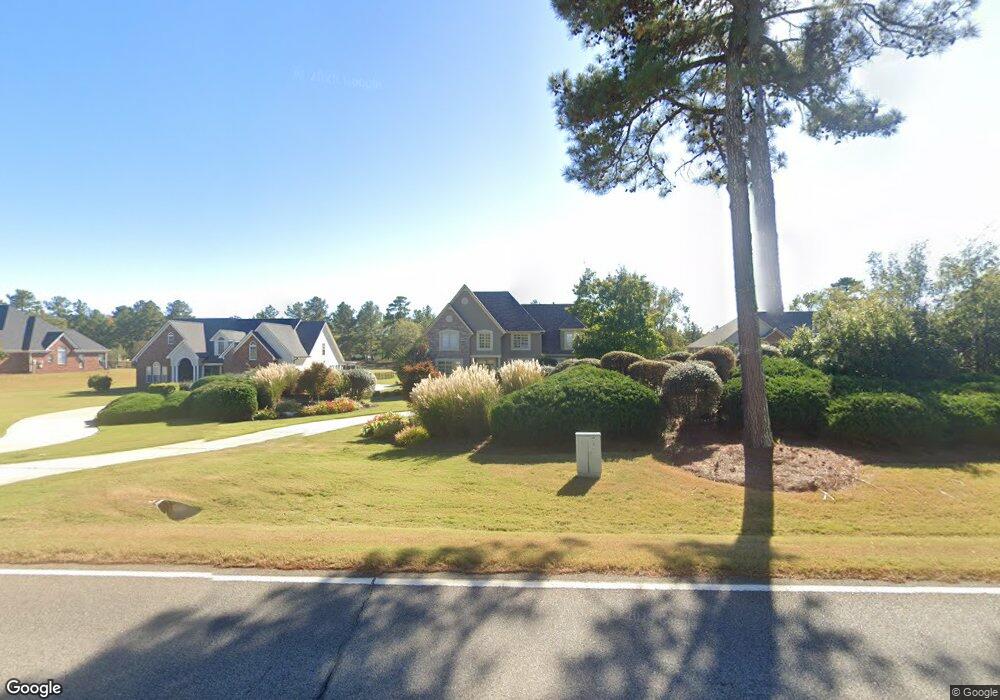
991 Palmetto Tyrone Rd Sharpsburg, GA 30277
Estimated Value: $588,000 - $742,000
5
Beds
4
Baths
4,204
Sq Ft
$160/Sq Ft
Est. Value
About This Home
This home is located at 991 Palmetto Tyrone Rd, Sharpsburg, GA 30277 and is currently estimated at $673,168, approximately $160 per square foot. 991 Palmetto Tyrone Rd is a home located in Coweta County with nearby schools including Canongate Elementary School, Madras Middle School, and Northgate High School.
Ownership History
Date
Name
Owned For
Owner Type
Purchase Details
Closed on
Aug 1, 2001
Sold by
Bob Adams Homes Inc
Bought by
Teel Greg A and Teel Patricia W
Current Estimated Value
Home Financials for this Owner
Home Financials are based on the most recent Mortgage that was taken out on this home.
Original Mortgage
$239,920
Outstanding Balance
$92,123
Interest Rate
7.09%
Mortgage Type
New Conventional
Estimated Equity
$581,045
Purchase Details
Closed on
Jul 15, 1999
Sold by
Patten Seed Company
Bought by
Bob Adams Homes Inc
Purchase Details
Closed on
Feb 29, 1988
Bought by
Patten Seed Company
Create a Home Valuation Report for This Property
The Home Valuation Report is an in-depth analysis detailing your home's value as well as a comparison with similar homes in the area
Home Values in the Area
Average Home Value in this Area
Purchase History
| Date | Buyer | Sale Price | Title Company |
|---|---|---|---|
| Teel Greg A | $299,900 | -- | |
| Bob Adams Homes Inc | $900,000 | -- | |
| Patten Seed Company | -- | -- |
Source: Public Records
Mortgage History
| Date | Status | Borrower | Loan Amount |
|---|---|---|---|
| Open | Teel Greg A | $239,920 |
Source: Public Records
Tax History Compared to Growth
Tax History
| Year | Tax Paid | Tax Assessment Tax Assessment Total Assessment is a certain percentage of the fair market value that is determined by local assessors to be the total taxable value of land and additions on the property. | Land | Improvement |
|---|---|---|---|---|
| 2025 | $5,312 | $270,152 | $32,000 | $238,152 |
| 2024 | $5,926 | $259,878 | $32,000 | $227,878 |
| 2023 | $5,926 | $211,783 | $32,000 | $179,783 |
| 2022 | $5,004 | $207,840 | $32,000 | $175,840 |
| 2021 | $4,506 | $175,850 | $20,000 | $155,850 |
| 2020 | $4,535 | $175,850 | $20,000 | $155,850 |
| 2019 | $3,734 | $132,368 | $24,000 | $108,368 |
| 2018 | $3,741 | $132,368 | $24,000 | $108,368 |
| 2017 | $3,740 | $132,368 | $24,000 | $108,368 |
| 2016 | $3,697 | $132,368 | $24,000 | $108,368 |
| 2015 | $3,637 | $132,368 | $24,000 | $108,368 |
| 2014 | $3,610 | $132,368 | $24,000 | $108,368 |
Source: Public Records
Map
Nearby Homes
- 9 Warrior Way
- 35 Palmer Place
- 20 Skipton Ct
- 56 Hudgen Rd
- 0 Fischer Spur Rd Unit 10495301
- 70 N Strathmore Dr
- 291 Cannongate Rd
- 518 Palmetto Tyrone Rd
- 40 Wenham Ln
- 40 Joe Lee Dr
- 30 Joe Lee Dr
- 10 Monteray Ct
- 259 Strathmore Dr Unit 3
- 127 Northgate Preserve Dr
- 46 I W Brooks Rd
- 78 Rosebay Ln
- 32 Riverbirch Way
- 50 Big Oaks Ct
- 27 Dorian Ct
- 306 Northgate Preserve Dr
- 981 Palmetto Tyrone Rd
- 995 Palmetto Tyrone Rd
- 977 Palmetto Tyrone Rd
- 1015 Palmetto Tyrone Rd
- 5 Oconee Woods Trail
- 973 Palmetto Tyrone Rd
- 1035 Palmetto Tyrone Rd
- 969 Palmetto Tyrone Rd
- 10 Oconee Woods Trail
- 37 Warrior Way
- 45 Warrior Way
- 1041 Palmetto Tyrone Rd
- 951 Palmetto Tyrone Rd
- 20 Oconee Woods Trail
- 57 Warrior Way
- 10 Warrior Way
- 938 Palmetto Tyrone Rd
- 929 Palmetto Tyrone Rd
- 38 Warrior Way
- 923 Palmetto Tyrone Rd