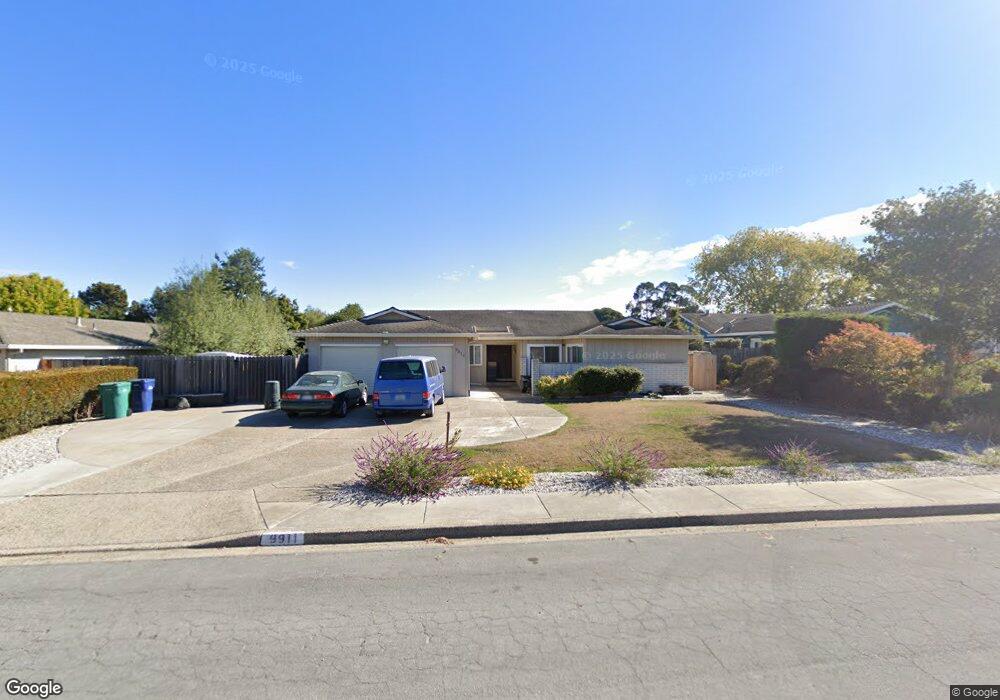
9911 Mimosa Path Salinas, CA 93907
Estimated Value: $781,000 - $834,000
4
Beds
2
Baths
1,912
Sq Ft
$423/Sq Ft
Est. Value
About This Home
This home is located at 9911 Mimosa Path, Salinas, CA 93907 and is currently estimated at $809,162, approximately $423 per square foot. 9911 Mimosa Path is a home located in Monterey County with nearby schools including North Monterey County Middle School, North Monterey County High School, and Oasis Charter Public.
Ownership History
Date
Name
Owned For
Owner Type
Purchase Details
Closed on
Aug 21, 2025
Sold by
Taylan Nellie V
Bought by
Nellie V Taylan Living Trust and Taylan
Current Estimated Value
Purchase Details
Closed on
Mar 17, 2021
Sold by
Taylan Genaro A and Taylan Nellie V
Bought by
Taylan Nellie V
Home Financials for this Owner
Home Financials are based on the most recent Mortgage that was taken out on this home.
Original Mortgage
$472,500
Interest Rate
2.73%
Mortgage Type
New Conventional
Purchase Details
Closed on
Nov 17, 2005
Sold by
Taylan Genaro A and Taylan Nellie V
Bought by
Taylan Genaro A and Taylan Nellie V
Home Financials for this Owner
Home Financials are based on the most recent Mortgage that was taken out on this home.
Original Mortgage
$215,000
Interest Rate
5.97%
Mortgage Type
New Conventional
Create a Home Valuation Report for This Property
The Home Valuation Report is an in-depth analysis detailing your home's value as well as a comparison with similar homes in the area
Home Values in the Area
Average Home Value in this Area
Purchase History
| Date | Buyer | Sale Price | Title Company |
|---|---|---|---|
| Nellie V Taylan Living Trust | -- | None Listed On Document | |
| Taylan Nellie V | -- | Fidelity National Title Co | |
| Taylan Genaro A | -- | Old Republic Title |
Source: Public Records
Mortgage History
| Date | Status | Borrower | Loan Amount |
|---|---|---|---|
| Previous Owner | Taylan Nellie V | $472,500 | |
| Previous Owner | Taylan Genaro A | $215,000 |
Source: Public Records
Tax History
| Year | Tax Paid | Tax Assessment Tax Assessment Total Assessment is a certain percentage of the fair market value that is determined by local assessors to be the total taxable value of land and additions on the property. | Land | Improvement |
|---|---|---|---|---|
| 2025 | $2,064 | $185,969 | $34,201 | $151,768 |
| 2024 | $2,064 | $182,324 | $33,531 | $148,793 |
| 2023 | $2,025 | $178,750 | $32,874 | $145,876 |
| 2022 | $2,007 | $175,246 | $32,230 | $143,016 |
| 2021 | $1,932 | $171,811 | $31,599 | $140,212 |
| 2020 | $1,866 | $170,050 | $31,275 | $138,775 |
| 2019 | $1,821 | $166,716 | $30,662 | $136,054 |
| 2018 | $1,787 | $163,448 | $30,061 | $133,387 |
| 2017 | $1,690 | $160,244 | $29,472 | $130,772 |
| 2016 | $1,756 | $157,103 | $28,895 | $128,208 |
| 2015 | $1,703 | $154,744 | $28,461 | $126,283 |
| 2014 | $1,673 | $151,714 | $27,904 | $123,810 |
Source: Public Records
Map
Nearby Homes
- 9810 Rye Ct
- 9717 Trefoil Place
- 13910 Monte Del Oro Unit 72
- 13906 Monte Del Oro Unit 70
- 13226 Cielo Azul Unit 250
- 13424 Agua Caliente Unit 213
- 13622 Monte Del Sol Unit 141
- 13624 Monte Del Sol Unit 142
- 14832 Mossy Oak Place
- 15105 Charter Oak Blvd
- 0 Benson Rd
- 0 Blackie Rd
- 15410 Oak Hills Dr
- 0 Del Monte Farms Rd
- 16787 Blackie Rd
- 0 Castroville Blvd
- 800 Dolan Rd Unit 40
- 800 Dolan Rd Unit 29
- 10361 Mcdougall St
- 10298 Tembladera St
- 9903 Mimosa Path
- 9908 Madras Place
- 9916 Madras Place
- 9927 Mimosa Path
- 9900 Madras Place
- 9910 Mimosa Path
- 9902 Mimosa Path
- 9918 Mimosa Path
- 9924 Madras Place
- 9934 Mimosa Path
- 9926 Mimosa Path
- 14459 Charter Oak Blvd
- 14455 Charter Oak Blvd
- 14463 Charter Oak Blvd
- 9894 Mimosa Ct
- 9925 Madras Place
- 9913 Timothy Path
- 9909 Madras Place
- 9905 Timothy Path
- 9929 Timothy Path
Your Personal Tour Guide
Ask me questions while you tour the home.