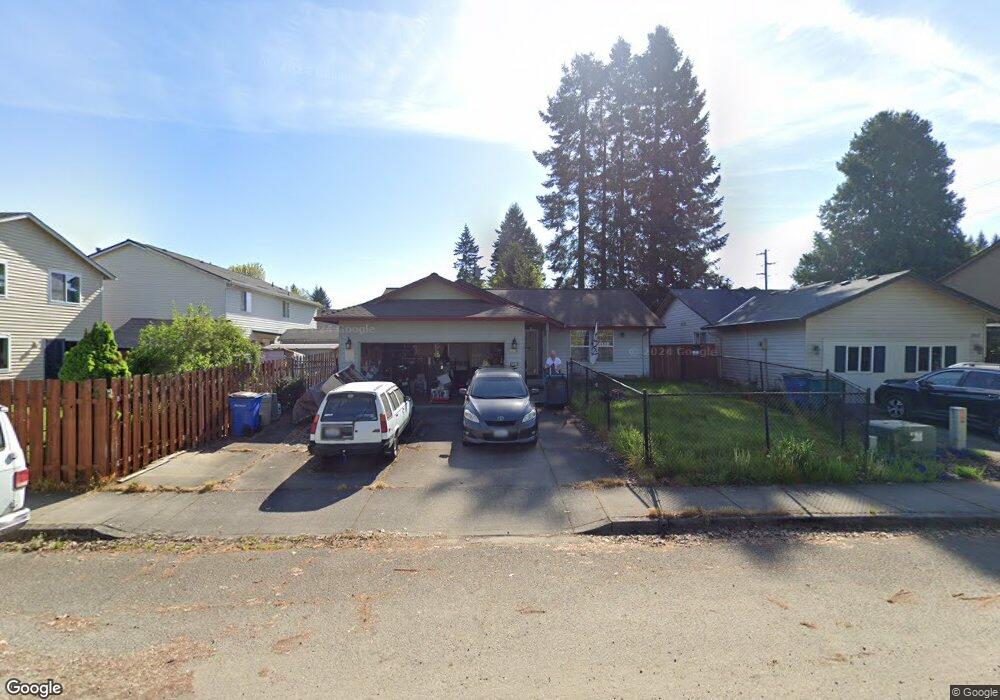
9911 NE 105th Ave Vancouver, WA 98662
Orchards Area NeighborhoodEstimated Value: $440,645 - $453,000
3
Beds
3
Baths
1,232
Sq Ft
$363/Sq Ft
Est. Value
About This Home
This home is located at 9911 NE 105th Ave, Vancouver, WA 98662 and is currently estimated at $446,911, approximately $362 per square foot. 9911 NE 105th Ave is a home located in Clark County with nearby schools including Glenwood Heights Primary School, Laurin Middle School, and Prairie High School.
Ownership History
Date
Name
Owned For
Owner Type
Purchase Details
Closed on
Apr 9, 2014
Sold by
Petersen Dana Louise
Bought by
Petersen Peter Stig
Current Estimated Value
Purchase Details
Closed on
Apr 25, 2001
Sold by
The Housing Authority City Vancouver
Bought by
Petersen Peter S and Petersen Dana L
Home Financials for this Owner
Home Financials are based on the most recent Mortgage that was taken out on this home.
Original Mortgage
$115,650
Outstanding Balance
$43,024
Interest Rate
6.98%
Estimated Equity
$403,887
Purchase Details
Closed on
Aug 11, 2000
Sold by
Clark County Skills Center/Clark Public
Bought by
The Housing Authority Of The City Of Van
Home Financials for this Owner
Home Financials are based on the most recent Mortgage that was taken out on this home.
Original Mortgage
$98,000
Interest Rate
8.19%
Purchase Details
Closed on
Nov 18, 1999
Sold by
Lang Brothers Enterprises Inc
Bought by
Clark County Skills Center/Clark Public
Home Financials for this Owner
Home Financials are based on the most recent Mortgage that was taken out on this home.
Original Mortgage
$97,500
Interest Rate
7.95%
Create a Home Valuation Report for This Property
The Home Valuation Report is an in-depth analysis detailing your home's value as well as a comparison with similar homes in the area
Home Values in the Area
Average Home Value in this Area
Purchase History
| Date | Buyer | Sale Price | Title Company |
|---|---|---|---|
| Petersen Peter Stig | -- | None Available | |
| Petersen Peter S | -- | Clark County Title Company | |
| The Housing Authority Of The City Of Van | $122,500 | Clark County Title Company | |
| Clark County Skills Center/Clark Public | $46,500 | Charter Title Corporation |
Source: Public Records
Mortgage History
| Date | Status | Borrower | Loan Amount |
|---|---|---|---|
| Open | Petersen Peter S | $115,650 | |
| Previous Owner | The Housing Authority Of The City Of Van | $98,000 | |
| Previous Owner | Clark County Skills Center/Clark Public | $97,500 |
Source: Public Records
Tax History Compared to Growth
Tax History
| Year | Tax Paid | Tax Assessment Tax Assessment Total Assessment is a certain percentage of the fair market value that is determined by local assessors to be the total taxable value of land and additions on the property. | Land | Improvement |
|---|---|---|---|---|
| 2025 | $3,171 | $382,174 | $160,000 | $222,174 |
| 2024 | $3,054 | $366,861 | $160,000 | $206,861 |
| 2023 | $3,141 | $392,831 | $162,500 | $230,331 |
| 2022 | $2,965 | $373,537 | $162,500 | $211,037 |
| 2021 | $2,973 | $319,960 | $137,500 | $182,460 |
| 2020 | $2,638 | $290,839 | $125,000 | $165,839 |
| 2019 | $2,265 | $250,756 | $94,250 | $156,506 |
| 2018 | $2,638 | $244,252 | $0 | $0 |
| 2017 | $2,409 | $216,207 | $0 | $0 |
| 2016 | $2,328 | $210,992 | $0 | $0 |
| 2015 | $2,360 | $187,455 | $0 | $0 |
| 2014 | -- | $179,655 | $0 | $0 |
| 2013 | -- | $146,961 | $0 | $0 |
Source: Public Records
Map
Nearby Homes
- 9411 NE 106th Ct
- 9701 NE 108th Ct
- 11000 NE 101st St
- 10006 NE 103rd St
- 10501 NE 109th Ct
- 10820 NE 106th St
- 10315 NE 107th St
- 10704 NE 107th Ct
- 10507 NE 90th St
- 10717 NE 109th St
- 10809 NE 102nd Ave
- 10205 NE 110th Cir
- 11309 NE Conifer Dr
- 10500 NE 110th Cir
- 10414 NE 95th Ave
- 10317 NE 116th Place
- 10809 NE 97th Ave
- 10512 NE 95th Ave
- 8520 NE 111th Ave
- 11218 NE 102nd Ave
- 9907 NE 105th Ave
- 10505 NE 100th St
- 10501 NE 100th St
- 10509 NE 100th St
- 9903 NE 105th Ave
- 10511 NE 100th St
- 10517 NE 100th St
- 10513 NE 100th St
- 10515 NE 100th St
- 10521 NE 100th St
- 10005 NE 105th Ave
- 10508 NE 100th St
- 10604 NE 99th St
- 9807 NE 105th Ave
- 10516 NE 100th St
- 9907 NE 104th Ct
- 9911 NE 104th Ct
- 10009 NE 105th Ave
- 10006 NE 105th Ave
- 9915 NE 104th Ct