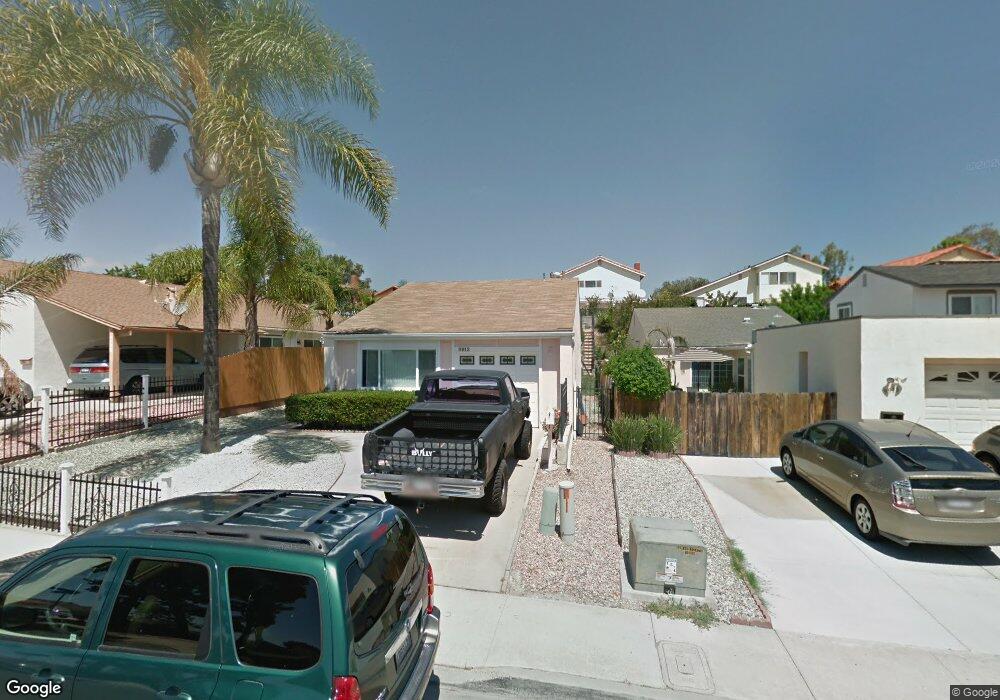
9912 Via Monzon San Diego, CA 92129
Rancho Peñasquitos NeighborhoodEstimated Value: $884,000 - $971,000
2
Beds
1
Bath
888
Sq Ft
$1,038/Sq Ft
Est. Value
About This Home
This home is located at 9912 Via Monzon, San Diego, CA 92129 and is currently estimated at $921,771, approximately $1,038 per square foot. 9912 Via Monzon is a home located in San Diego County with nearby schools including Sunset Hills Elementary School, Black Mountain Middle School, and Mt. Carmel High School.
Ownership History
Date
Name
Owned For
Owner Type
Purchase Details
Closed on
May 14, 2020
Sold by
Eagle Natalie Red and Eagle Nathan Red
Bought by
Eagle Natalie Red and Eagle Nathan Red
Current Estimated Value
Home Financials for this Owner
Home Financials are based on the most recent Mortgage that was taken out on this home.
Original Mortgage
$415,000
Outstanding Balance
$367,748
Interest Rate
3.3%
Mortgage Type
New Conventional
Estimated Equity
$554,023
Purchase Details
Closed on
Feb 26, 2020
Sold by
Eagle Natalie Red and Eagle Nathan Red
Bought by
Eagle Natalie Red and Eagle Nathan Red
Purchase Details
Closed on
Aug 16, 2017
Sold by
The Neka Roseza Aukerman Family Trust
Bought by
Eagle Natalie Red and Eagle Nathan Red
Home Financials for this Owner
Home Financials are based on the most recent Mortgage that was taken out on this home.
Original Mortgage
$432,000
Interest Rate
3.96%
Mortgage Type
New Conventional
Purchase Details
Closed on
May 26, 1999
Sold by
Aukerman Neka R
Bought by
The Neka Roseza Aukerman Family Trust
Create a Home Valuation Report for This Property
The Home Valuation Report is an in-depth analysis detailing your home's value as well as a comparison with similar homes in the area
Home Values in the Area
Average Home Value in this Area
Purchase History
| Date | Buyer | Sale Price | Title Company |
|---|---|---|---|
| Eagle Natalie Red | -- | Accommodation | |
| Eagle Natalie Red | -- | None Available | |
| Eagle Natalie Red | $480,000 | Lawyers Title | |
| The Neka Roseza Aukerman Family Trust | -- | -- |
Source: Public Records
Mortgage History
| Date | Status | Borrower | Loan Amount |
|---|---|---|---|
| Open | Eagle Natalie Red | $415,000 | |
| Closed | Eagle Natalie Red | $432,000 |
Source: Public Records
Tax History Compared to Growth
Tax History
| Year | Tax Paid | Tax Assessment Tax Assessment Total Assessment is a certain percentage of the fair market value that is determined by local assessors to be the total taxable value of land and additions on the property. | Land | Improvement |
|---|---|---|---|---|
| 2025 | $6,008 | $546,151 | $166,529 | $379,622 |
| 2024 | $6,008 | $535,443 | $163,264 | $372,179 |
| 2023 | $5,878 | $524,945 | $160,063 | $364,882 |
| 2022 | $5,777 | $514,653 | $156,925 | $357,728 |
| 2021 | $5,699 | $504,563 | $153,849 | $350,714 |
| 2020 | $5,701 | $499,390 | $152,272 | $347,118 |
| 2019 | $5,553 | $489,599 | $149,287 | $340,312 |
| 2018 | $5,396 | $480,000 | $146,360 | $333,640 |
| 2017 | $83 | $117,052 | $35,691 | $81,361 |
| 2016 | $1,316 | $114,758 | $34,992 | $79,766 |
| 2015 | $1,296 | $113,035 | $34,467 | $78,568 |
| 2014 | $1,267 | $110,821 | $33,792 | $77,029 |
Source: Public Records
Map
Nearby Homes
- 9858 Via Caceres
- 13837 Paseo Cardiel
- 13856 Paseo Cardiel
- 9531 Bayamon Rd
- 10049 Riverhead Dr
- 10131 Freeport Ct
- 9525 High Park Ln
- 13343 Rancho Penasquitos Blvd Unit B 202
- 9720 Graceland Way
- 9959 Azuaga St Unit 105
- 13202 Salmon River Rd Unit 101
- 13113 Calle de Las Rosas
- 12940 Calle de Las Rosas
- 12979 Calle de Las Rosas
- 13335 Caminito Ciera Unit 89
- 9462 Pipilo St
- 12848 Salmon River Rd
- 10472 Caminito Rimini
- 13749 Caminito Vizzini Unit 73
- 12835 Via Caballo Rojo
- 9918 Via Monzon
- 9908 Via Monzon
- 9904 Via Monzon
- 9924 Via Monzon
- 9845 Via Caceres
- 9930 Via Monzon
- 9833 Via Caceres
- 9890 Via Monzon
- 9855 Via Caceres
- 13733 Via Huelva
- 9823 Via Caceres
- 9936 Via Monzon
- 9884 Via Monzon
- 9867 Via Caceres
- 13740 Via Huelva
- 13723 Via Huelva
- 9937 Via Monzon
- 9811 Via Caceres
- 9942 Via Monzon
- 13730 Via Huelva