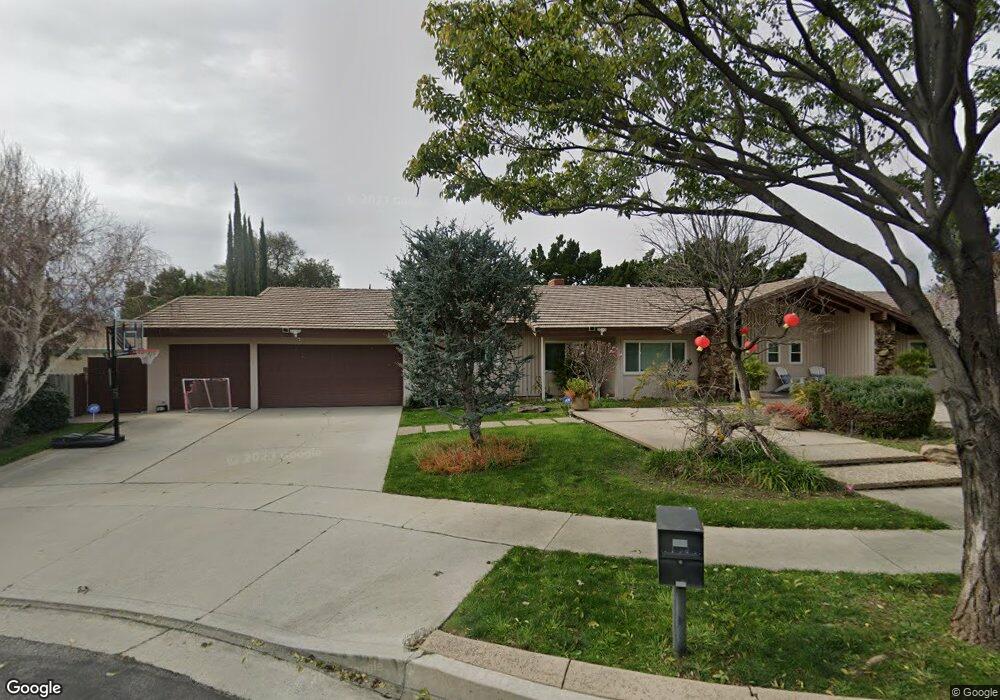
9913 Shirley Ave Northridge, CA 91324
Estimated Value: $1,557,000 - $1,608,000
5
Beds
4
Baths
3,278
Sq Ft
$483/Sq Ft
Est. Value
About This Home
This home is located at 9913 Shirley Ave, Northridge, CA 91324 and is currently estimated at $1,583,046, approximately $482 per square foot. 9913 Shirley Ave is a home located in Los Angeles County with nearby schools including Topeka Charter School For Advanced Studies, Our Community School, and Superior Street Elementary School.
Ownership History
Date
Name
Owned For
Owner Type
Purchase Details
Closed on
Oct 11, 2017
Sold by
Barnhard Robert H and Barnhard Rhoda
Bought by
Nguyen Huy Huy P and Giang Lan Nha
Current Estimated Value
Home Financials for this Owner
Home Financials are based on the most recent Mortgage that was taken out on this home.
Original Mortgage
$732,000
Outstanding Balance
$611,590
Interest Rate
3.83%
Mortgage Type
New Conventional
Estimated Equity
$971,456
Purchase Details
Closed on
Sep 21, 2006
Sold by
Barnhard Robert H and Barnhard Rhoda
Bought by
Barnhard Robert H and Barnhard Rhoda
Purchase Details
Closed on
Aug 10, 2004
Sold by
Barnhard Robert H and Barnhard Rhoda
Bought by
Barnhard Robert H and Barnhard Rhoda
Home Financials for this Owner
Home Financials are based on the most recent Mortgage that was taken out on this home.
Original Mortgage
$200,000
Interest Rate
5.92%
Mortgage Type
Credit Line Revolving
Create a Home Valuation Report for This Property
The Home Valuation Report is an in-depth analysis detailing your home's value as well as a comparison with similar homes in the area
Home Values in the Area
Average Home Value in this Area
Purchase History
| Date | Buyer | Sale Price | Title Company |
|---|---|---|---|
| Nguyen Huy Huy P | $915,000 | Lawyers Title | |
| Barnhard Robert H | -- | None Available | |
| Barnhard Robert H | -- | None Available | |
| Barnhard Robert H | -- | -- | |
| Barnhard Robert H | -- | Ticor Title Company Of Calif |
Source: Public Records
Mortgage History
| Date | Status | Borrower | Loan Amount |
|---|---|---|---|
| Open | Nguyen Huy Huy P | $732,000 | |
| Previous Owner | Barnhard Robert H | $200,000 |
Source: Public Records
Tax History Compared to Growth
Tax History
| Year | Tax Paid | Tax Assessment Tax Assessment Total Assessment is a certain percentage of the fair market value that is determined by local assessors to be the total taxable value of land and additions on the property. | Land | Improvement |
|---|---|---|---|---|
| 2025 | $12,887 | $1,041,111 | $677,007 | $364,104 |
| 2024 | $12,887 | $1,020,698 | $663,733 | $356,965 |
| 2023 | $12,644 | $1,000,685 | $650,719 | $349,966 |
| 2022 | $12,071 | $981,064 | $637,960 | $343,104 |
| 2021 | $11,914 | $961,828 | $625,451 | $336,377 |
| 2019 | $11,566 | $933,300 | $606,900 | $326,400 |
| 2018 | $2,850 | $205,509 | $40,049 | $165,460 |
| 2017 | $2,792 | $201,480 | $39,264 | $162,216 |
| 2016 | $2,694 | $197,531 | $38,495 | $159,036 |
| 2015 | $2,659 | $194,565 | $37,917 | $156,648 |
| 2014 | $2,678 | $190,755 | $37,175 | $153,580 |
Source: Public Records
Map
Nearby Homes
- 19651 Marilla St
- 9701 Bothwell Rd
- 19621 Citronia St
- 19530 Tuba St
- 9830 Oakdale Ave
- 19523 Ballinger St
- 9733 Kessler Ave
- 19200 Ballinger St
- 20124 Lassen St
- 10225 Donna Ave
- 9514 Penfield Ave
- 9301 Shirley Ave Unit 70
- 20158 Septo St
- 10405 Lubao Ave
- 19505 Cardigan Dr
- 19933 Hiawatha St
- 20129 Halsted St
- 19513 Astor Place
- 19128 Prairie St
- 20323 Kinzie St
- 9901 Shirley Ave
- 9925 Shirley Ave
- 9912 Melvin Ave
- 9924 Melvin Ave
- 9900 Melvin Ave
- 9912 Shirley Ave
- 9900 Shirley Ave
- 9924 Shirley Ave
- 9937 Shirley Ave
- 9936 Melvin Ave
- 9849 Belmar Ave
- 9936 Shirley Ave
- 9913 Tunney Ave
- 9901 Melvin Ave
- 9850 Melvin Ave
- 9911 Melvin Ave
- 9901 Tunney Ave
- 9925 Tunney Ave
- 9949 Shirley Ave
- 9852 Belmar Ave