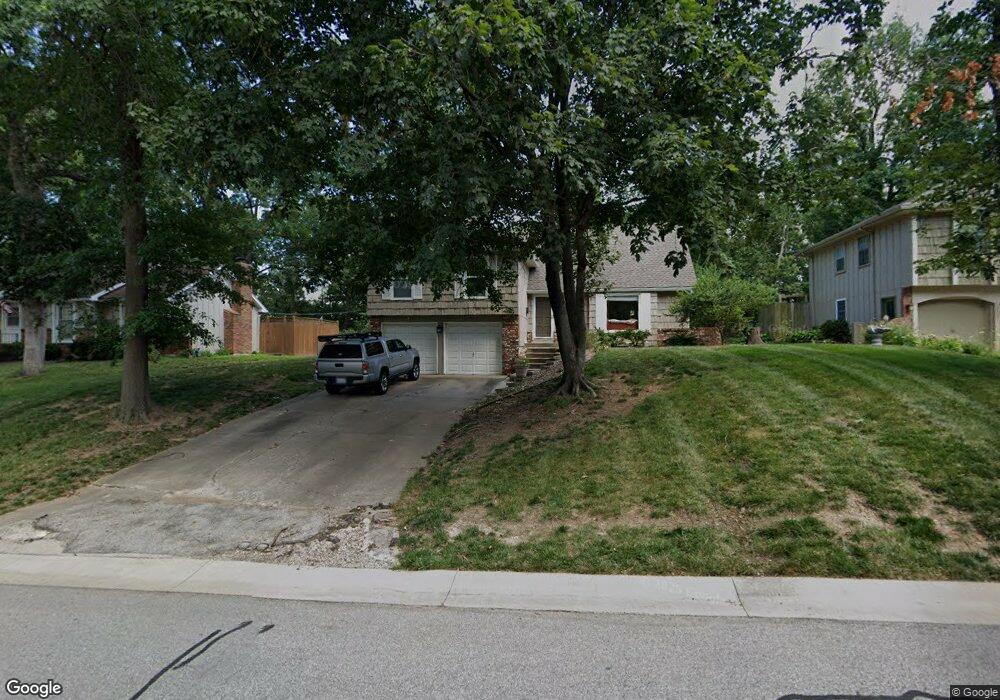
9913 W 70th Terrace Shawnee, KS 66203
Estimated Value: $344,000 - $362,000
4
Beds
3
Baths
1,432
Sq Ft
$246/Sq Ft
Est. Value
About This Home
This home is located at 9913 W 70th Terrace, Shawnee, KS 66203 and is currently estimated at $352,620, approximately $246 per square foot. 9913 W 70th Terrace is a home located in Johnson County with nearby schools including Nieman Elementary School, Hocker Grove Middle School, and Shawnee Mission North High School.
Ownership History
Date
Name
Owned For
Owner Type
Purchase Details
Closed on
Mar 21, 2022
Sold by
Nelson Justin J
Bought by
Nelson Justin J and Nelson Christine A
Current Estimated Value
Home Financials for this Owner
Home Financials are based on the most recent Mortgage that was taken out on this home.
Original Mortgage
$103,500
Outstanding Balance
$83,822
Interest Rate
3.39%
Mortgage Type
New Conventional
Estimated Equity
$268,798
Purchase Details
Closed on
Jul 6, 2005
Sold by
Goodrich Robert Paul and Goodrich Cynthia Lynn
Bought by
Nelson Justin J
Home Financials for this Owner
Home Financials are based on the most recent Mortgage that was taken out on this home.
Original Mortgage
$15,000
Interest Rate
5.58%
Mortgage Type
Credit Line Revolving
Create a Home Valuation Report for This Property
The Home Valuation Report is an in-depth analysis detailing your home's value as well as a comparison with similar homes in the area
Home Values in the Area
Average Home Value in this Area
Purchase History
| Date | Buyer | Sale Price | Title Company |
|---|---|---|---|
| Nelson Justin J | -- | New Title Company Name | |
| Nelson Justin J | -- | First American Title Slt |
Source: Public Records
Mortgage History
| Date | Status | Borrower | Loan Amount |
|---|---|---|---|
| Open | Nelson Justin J | $103,500 | |
| Previous Owner | Nelson Justin J | $15,000 | |
| Previous Owner | Nelson Justin J | $130,000 |
Source: Public Records
Tax History Compared to Growth
Tax History
| Year | Tax Paid | Tax Assessment Tax Assessment Total Assessment is a certain percentage of the fair market value that is determined by local assessors to be the total taxable value of land and additions on the property. | Land | Improvement |
|---|---|---|---|---|
| 2024 | $3,920 | $36,617 | $6,153 | $30,464 |
| 2023 | $3,690 | $35,145 | $6,153 | $28,992 |
| 2022 | $3,258 | $29,969 | $5,592 | $24,377 |
| 2021 | $3,126 | $27,462 | $4,858 | $22,604 |
| 2020 | $2,879 | $25,128 | $4,858 | $20,270 |
| 2019 | $2,711 | $23,656 | $4,230 | $19,426 |
| 2018 | $2,643 | $22,966 | $3,853 | $19,113 |
| 2017 | $2,381 | $20,436 | $3,853 | $16,583 |
| 2016 | $2,250 | $19,102 | $3,853 | $15,249 |
| 2015 | $2,155 | $18,447 | $3,853 | $14,594 |
| 2013 | -- | $18,033 | $3,853 | $14,180 |
Source: Public Records
Map
Nearby Homes
- 10024 W 70th Terrace
- 9906 Edelweiss Cir
- 10235 W 70th St
- 10152 Edelweiss Cir
- 10236 Edelweiss Cir
- 10406 W 71st Place
- 7240 Mastin St
- 10314 W 73rd St
- 7226 Edgewood Blvd
- 7410 Stearns St
- 6901 Grandview St
- 10902 W 71st Place
- 10914 W 71st St
- 7425 Melrose Ln
- 10120 W 65th St
- 7219 Reeder St
- 10924 W 67th St
- 11217 W 69th Terrace
- 6724 Mackey St
- 11406 W 71st St
- 10001 W 70th Terrace
- 9911 W 70th Terrace
- 9909 W 70th Terrace
- 10003 W 70th Terrace
- 10000 W 70th Terrace
- 9912 W 70th Terrace
- 9907 W 70th Terrace
- 9908 W 70th Terrace
- 9900 W 71st St
- 10005 W 70th Terrace
- 10008 W 70th Terrace
- 9904 W 70th Terrace
- 10006 Carrie Ln
- 10007 Carrie Ln
- 9905 W 70th Terrace
- 10007 W 70th Terrace
- 10008 Carrie Ln
- 9900 W 70th Terrace
- 10009 W 70th Terrace
- 9820 W 71st St