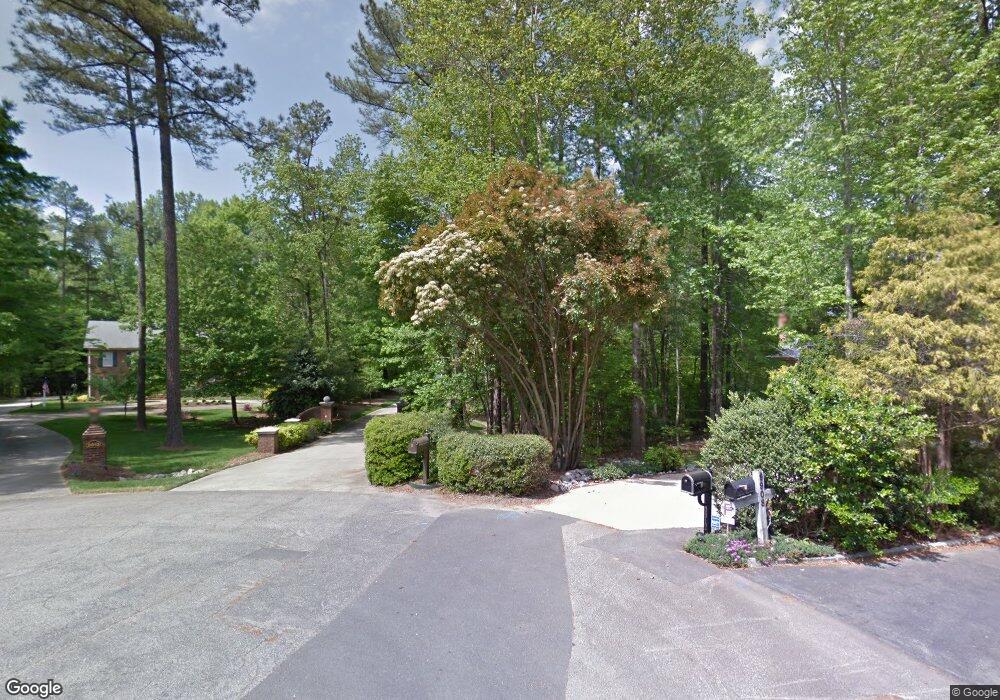
9916 Cape Scott Ct Raleigh, NC 27614
Falls Lake NeighborhoodEstimated Value: $1,363,000 - $1,706,000
6
Beds
6
Baths
5,098
Sq Ft
$295/Sq Ft
Est. Value
About This Home
This home is located at 9916 Cape Scott Ct, Raleigh, NC 27614 and is currently estimated at $1,504,898, approximately $295 per square foot. 9916 Cape Scott Ct is a home located in Wake County with nearby schools including Brassfield Elementary School, West Millbrook Middle School, and Millbrook High School.
Ownership History
Date
Name
Owned For
Owner Type
Purchase Details
Closed on
Nov 14, 2019
Sold by
Jordan Dino J and Jordan Gail J
Bought by
Pnc Bank National Association
Current Estimated Value
Purchase Details
Closed on
Jul 31, 1997
Sold by
Williams Graham J and Williams Michele M
Bought by
Jordan Dino Jefferson and Jordan Gail Jennifer
Home Financials for this Owner
Home Financials are based on the most recent Mortgage that was taken out on this home.
Original Mortgage
$750,000
Interest Rate
7.25%
Create a Home Valuation Report for This Property
The Home Valuation Report is an in-depth analysis detailing your home's value as well as a comparison with similar homes in the area
Home Values in the Area
Average Home Value in this Area
Purchase History
| Date | Buyer | Sale Price | Title Company |
|---|---|---|---|
| Pnc Bank National Association | $91,260 | None Available | |
| Jordan Dino Jefferson | $760,000 | -- |
Source: Public Records
Mortgage History
| Date | Status | Borrower | Loan Amount |
|---|---|---|---|
| Previous Owner | Jordan Dino Jefferson | $750,000 |
Source: Public Records
Tax History Compared to Growth
Tax History
| Year | Tax Paid | Tax Assessment Tax Assessment Total Assessment is a certain percentage of the fair market value that is determined by local assessors to be the total taxable value of land and additions on the property. | Land | Improvement |
|---|---|---|---|---|
| 2025 | $6,891 | $1,074,278 | $360,000 | $714,278 |
| 2024 | $6,656 | $1,068,591 | $360,000 | $708,591 |
| 2023 | $6,884 | $880,393 | $170,000 | $710,393 |
| 2022 | $6,378 | $880,393 | $170,000 | $710,393 |
| 2021 | $6,207 | $880,393 | $170,000 | $710,393 |
| 2020 | $6,104 | $880,393 | $170,000 | $710,393 |
| 2019 | $8,831 | $1,078,865 | $150,000 | $928,865 |
| 2018 | $8,116 | $1,078,865 | $150,000 | $928,865 |
| 2017 | $7,691 | $1,078,865 | $150,000 | $928,865 |
| 2016 | $7,534 | $1,078,865 | $150,000 | $928,865 |
| 2015 | $7,566 | $1,086,489 | $155,000 | $931,489 |
| 2014 | $7,169 | $1,086,489 | $155,000 | $931,489 |
Source: Public Records
Map
Nearby Homes
- 9925 Koupela Dr
- 4817 Fox Branch Ct
- 4708 Wynneford Way
- 1209 Ravens Point Cir
- 11705 Durant Rd
- 5420 Deer Forest Trail
- 10708 Trappers Creek Dr
- 9801 Honeycutt Rd
- 904 Stonecutter Ct
- 900 Stonecutter Ct
- 917 Welland Ct
- 10721 Marabou Ct
- 11100 Honeycutt Rd
- 6729 Greywalls Ln
- 10630 Pleasant Branch Dr Unit Lot 5
- 10545 Pleasant Branch Dr Unit 101
- 4900 Foxridge Dr
- 10610 Pleasant Branch Dr Unit Lot 15
- 10610 Pleasant Branch Dr Unit Lot 13
- 10608 Pleasant Branch Dr Unit Lot 14
- 9913 Cape Scott Ct
- 9912 Cape Scott Ct
- 9908 Cape Scott Ct
- 9909 Cape Scott Ct
- 9905 Cape Scott Ct
- 9904 Cape Scott Ct
- 9901 Cape Scott Ct
- 9900 Cape Scott Ct
- 1320 King Cross Ct
- 9929 Koupela Dr
- 1300 King Cross Ct
- 9921 Koupela Dr
- 9909 Koupela Dr
- 9917 Koupela Dr
- 9933 Koupela Dr
- 1309 King Cross Ct
- 1313 King Cross Ct
- 1321 King Cross Ct
- 1312 Enderbury Dr
- 5504 Wynneford Way