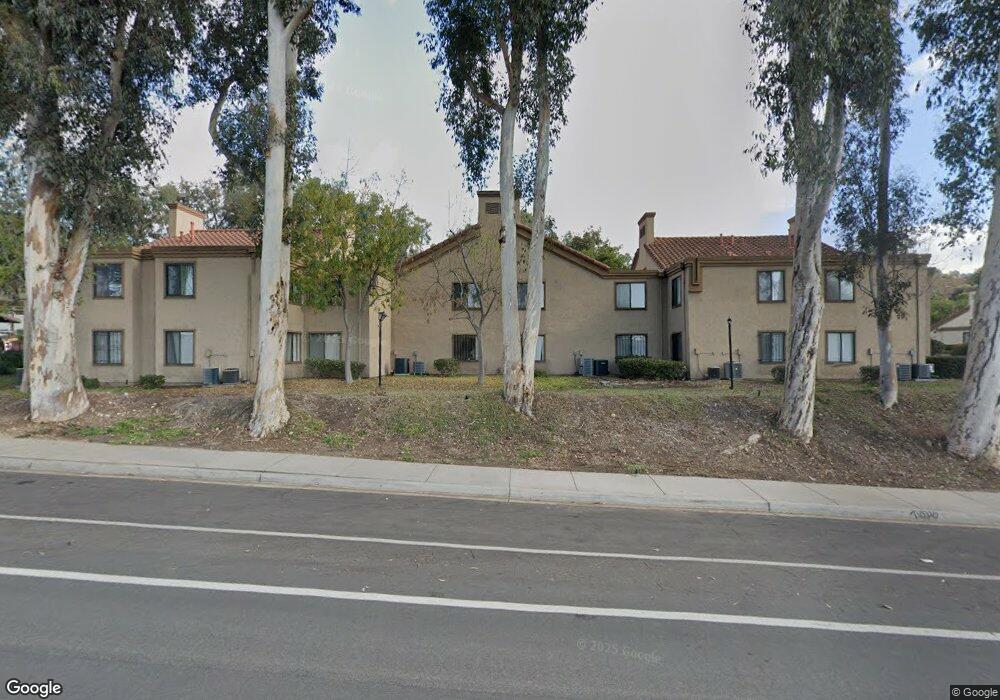
9916 Scripps Westview Way Unit 164 San Diego, CA 92131
Scripps Ranch NeighborhoodEstimated Value: $454,000 - $517,000
1
Bed
1
Bath
719
Sq Ft
$659/Sq Ft
Est. Value
About This Home
This home is located at 9916 Scripps Westview Way Unit 164, San Diego, CA 92131 and is currently estimated at $473,952, approximately $659 per square foot. 9916 Scripps Westview Way Unit 164 is a home located in San Diego County with nearby schools including Miramar Ranch Elementary School, Thurgood Marshall Middle School, and Scripps Ranch High School.
Ownership History
Date
Name
Owned For
Owner Type
Purchase Details
Closed on
May 5, 2015
Sold by
Blake John and Blake Sara
Bought by
Vogt Michele A
Current Estimated Value
Home Financials for this Owner
Home Financials are based on the most recent Mortgage that was taken out on this home.
Original Mortgage
$201,188
Outstanding Balance
$154,932
Interest Rate
3.67%
Mortgage Type
FHA
Estimated Equity
$319,020
Purchase Details
Closed on
Jan 6, 2009
Sold by
Blake John T
Bought by
Blake John T
Purchase Details
Closed on
Jan 31, 2000
Sold by
Blake Danny T
Bought by
Blake John T
Purchase Details
Closed on
Sep 30, 1988
Purchase Details
Closed on
Apr 20, 1984
Create a Home Valuation Report for This Property
The Home Valuation Report is an in-depth analysis detailing your home's value as well as a comparison with similar homes in the area
Home Values in the Area
Average Home Value in this Area
Purchase History
| Date | Buyer | Sale Price | Title Company |
|---|---|---|---|
| Vogt Michele A | $205,000 | Chicago Title Company | |
| Blake John T | -- | None Available | |
| Blake John T | -- | Fidelity National Title Co | |
| -- | $61,000 | -- | |
| -- | $63,500 | -- |
Source: Public Records
Mortgage History
| Date | Status | Borrower | Loan Amount |
|---|---|---|---|
| Open | Vogt Michele A | $201,188 |
Source: Public Records
Tax History Compared to Growth
Tax History
| Year | Tax Paid | Tax Assessment Tax Assessment Total Assessment is a certain percentage of the fair market value that is determined by local assessors to be the total taxable value of land and additions on the property. | Land | Improvement |
|---|---|---|---|---|
| 2025 | $3,018 | $246,249 | $96,954 | $149,295 |
| 2024 | $3,018 | $241,421 | $95,053 | $146,368 |
| 2023 | $2,951 | $236,689 | $93,190 | $143,499 |
| 2022 | $2,872 | $232,049 | $91,363 | $140,686 |
| 2021 | $2,852 | $227,500 | $89,572 | $137,928 |
| 2020 | $2,817 | $225,168 | $88,654 | $136,514 |
| 2019 | $2,767 | $220,754 | $86,916 | $133,838 |
| 2018 | $2,589 | $216,426 | $85,212 | $131,214 |
| 2017 | $2,528 | $212,184 | $83,542 | $128,642 |
| 2016 | $2,487 | $208,024 | $81,904 | $126,120 |
| 2015 | $1,268 | $104,208 | $41,029 | $63,179 |
| 2014 | -- | $102,168 | $40,226 | $61,942 |
Source: Public Records
Map
Nearby Homes
- 9909 Scripps Westview Way Unit 212
- 11325 Affinity Ct Unit 151
- 9899 Scripps Westview Way Unit 243
- 9899 Scripps Westview Way Unit 244
- 11265 Affinity Ct Unit 103
- 11235 Affinity Ct Unit 68
- 11215 Affinity Ct Unit 80
- 11175 Affinity Ct Unit 45
- 9960 Scripps Vista Way Unit 116
- 11115 Affinity Ct Unit 1
- 11365 Affinity Ct Unit 192
- 9939 Erma Rd Unit 101
- 9959 Erma Rd Unit 104
- 11482 Cortina Place
- 11091 Ice Skate Place Unit 20
- 11061 Scripps Ranch Blvd
- 11856 Miro Cir
- 9471 Compass Point Dr S
- 11825 Miro Cir
- 10885 Scripps Ranch Blvd Unit 3
- 9926 Scripps Westview Way Unit 252
- 9916 Scripps Westview Way Unit 264
- 9916 Scripps Westview Way Unit 163
- 9926 Scripps Westview Way Unit 151
- 9926 Scripps Westview Way Unit 154
- 9916 Scripps Westview Way Unit 161
- 9916 Scripps Westview Way Unit 166
- 9916 Scripps Westview Way Unit 266
- 9936 Scripps Westview Way Unit 156
- 9936 Scrps Westvw Way Unit 160
- 9936 Scrps Westvw Way Unit 155
- 9916 Scrps Westvw Way Unit 265
- 9916 Scrps Westvw Way Unit 266
- 9916 Scrps Westvw Way Unit 264
- 9916 Scrps Westvw Way Unit 263
- 9916 Scrps Westvw Way Unit 262
- 9916 Scrps Westvw Way Unit 261
- 9936 Scrps Westvw Way Unit 260
- 9936 Scrps Westvw Way Unit 259
- 9936 Scrps Westvw Way Unit 258