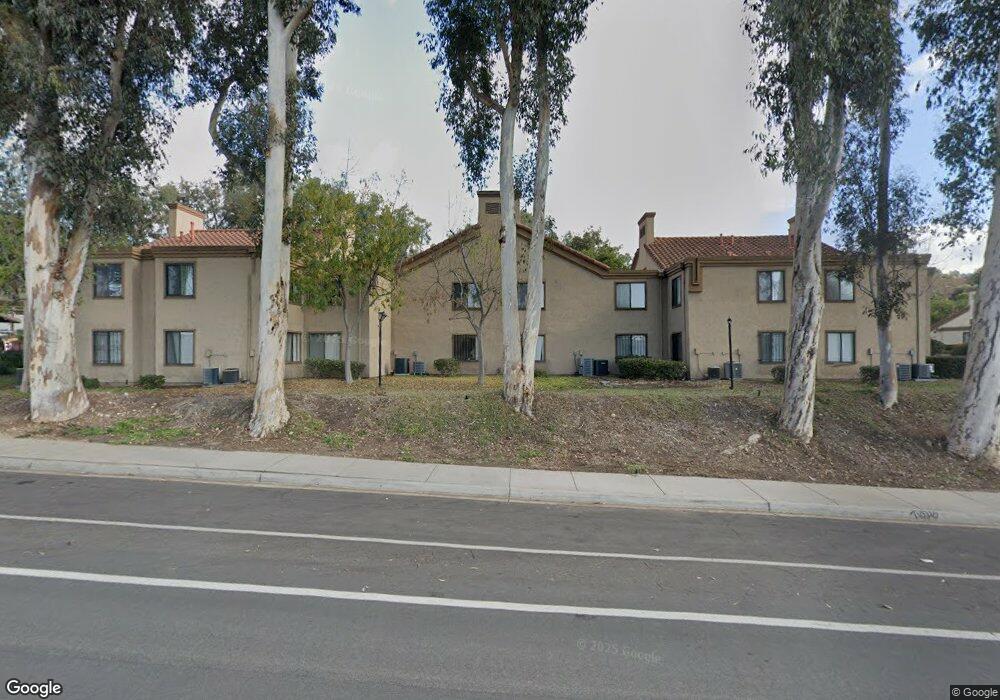
9916 Scrps Westvw Way Unit 265 San Diego, CA 92131
Scripps Ranch NeighborhoodEstimated Value: $595,180 - $708,000
2
Beds
2
Baths
1,052
Sq Ft
$607/Sq Ft
Est. Value
About This Home
This home is located at 9916 Scrps Westvw Way Unit 265, San Diego, CA 92131 and is currently estimated at $638,045, approximately $606 per square foot. 9916 Scrps Westvw Way Unit 265 is a home located in San Diego County with nearby schools including Miramar Ranch Elementary School, Thurgood Marshall Middle School, and Scripps Ranch High School.
Ownership History
Date
Name
Owned For
Owner Type
Purchase Details
Closed on
Aug 28, 2018
Sold by
Li Wei and Fang Ling
Bought by
Li Wei and Fang Ling
Current Estimated Value
Purchase Details
Closed on
Dec 30, 2010
Sold by
Lim Shing and Lim Jie
Bought by
Lim Shing and Lim Jie Fang
Purchase Details
Closed on
May 12, 2009
Sold by
Ng Check Yun and Ng Lan
Bought by
Ng Check Yun and Ng Lan
Purchase Details
Closed on
Feb 15, 2000
Sold by
Domiano Christina A
Bought by
Ng Check Yun and Ng Lan
Purchase Details
Closed on
Feb 11, 2000
Sold by
Katherine Langlois
Bought by
Domiano Christina Ann
Purchase Details
Closed on
Mar 27, 1992
Purchase Details
Closed on
Jun 6, 1984
Create a Home Valuation Report for This Property
The Home Valuation Report is an in-depth analysis detailing your home's value as well as a comparison with similar homes in the area
Home Values in the Area
Average Home Value in this Area
Purchase History
| Date | Buyer | Sale Price | Title Company |
|---|---|---|---|
| Li Wei | -- | None Available | |
| Lim Shing | -- | None Available | |
| Ng Check Yun | -- | None Available | |
| Ng Check Yun | -- | Commonwealth Land Title Co | |
| Domiano Christina Ann | $131,000 | Commonwealth Land Title Co | |
| -- | $114,000 | -- | |
| -- | $79,900 | -- |
Source: Public Records
Tax History Compared to Growth
Tax History
| Year | Tax Paid | Tax Assessment Tax Assessment Total Assessment is a certain percentage of the fair market value that is determined by local assessors to be the total taxable value of land and additions on the property. | Land | Improvement |
|---|---|---|---|---|
| 2025 | $2,477 | $201,321 | $76,838 | $124,483 |
| 2024 | $2,477 | $197,375 | $75,332 | $122,043 |
| 2023 | $2,422 | $193,505 | $73,855 | $119,650 |
| 2022 | $2,357 | $189,711 | $72,407 | $117,304 |
| 2021 | $2,340 | $185,992 | $70,988 | $115,004 |
| 2020 | $2,312 | $184,086 | $70,261 | $113,825 |
| 2019 | $2,271 | $180,478 | $68,884 | $111,594 |
| 2018 | $2,125 | $176,940 | $67,534 | $109,406 |
| 2017 | $2,075 | $173,471 | $66,210 | $107,261 |
| 2016 | $2,041 | $170,070 | $64,912 | $105,158 |
| 2015 | $2,011 | $167,516 | $63,937 | $103,579 |
| 2014 | $1,980 | $164,236 | $62,685 | $101,551 |
Source: Public Records
Map
Nearby Homes
- 11315 Affinity Ct Unit 148
- 11235 Affinity Ct Unit 68
- 9899 Scripps Westview Way Unit 244
- 11175 Affinity Ct Unit 45
- 9929 Erma Rd Unit 102
- 11061 Scripps Ranch Blvd
- 11575 Westview Pkwy
- 10770 Black Mountain Rd
- 11394 Pegasus Ave
- 9068 Kirby Ct
- 11901 Westview Pkwy
- 11799 Westview Pkwy
- 9005 Ticket St
- 8943 Calliandra Rd
- 10941 Waterton Rd
- 11129 Caminito Arcada Unit 256
- 11148 Twinleaf Way
- 9432 Hito Ct
- 11368 Squamish Rd
- 9036 Caminito Vera Unit 224
- 9936 Scrps Westvw Way Unit 160
- 9936 Scrps Westvw Way Unit 155
- 9916 Scrps Westvw Way Unit 266
- 9916 Scrps Westvw Way Unit 264
- 9916 Scrps Westvw Way Unit 263
- 9916 Scrps Westvw Way Unit 262
- 9916 Scrps Westvw Way Unit 261
- 9936 Scrps Westvw Way Unit 260
- 9936 Scrps Westvw Way Unit 259
- 9936 Scrps Westvw Way Unit 258
- 9936 Scrps Westvw Way Unit 257
- 9936 Scrps Westvw Way Unit 159
- 9936 Scrps Westvw Way Unit 158
- 9936 Scrps Westvw Way Unit 157
- 9936 Scrps Westvw Way Unit 156
- 9936 Scrps Westvw Way Unit 256
- 9936 Scrps Westvw Way Unit 255
- 9916 Scrps Westvw Way Unit 166
- 9916 Scrps Westvw Way Unit 165
- 9916 Scrps Westvw Way Unit 164