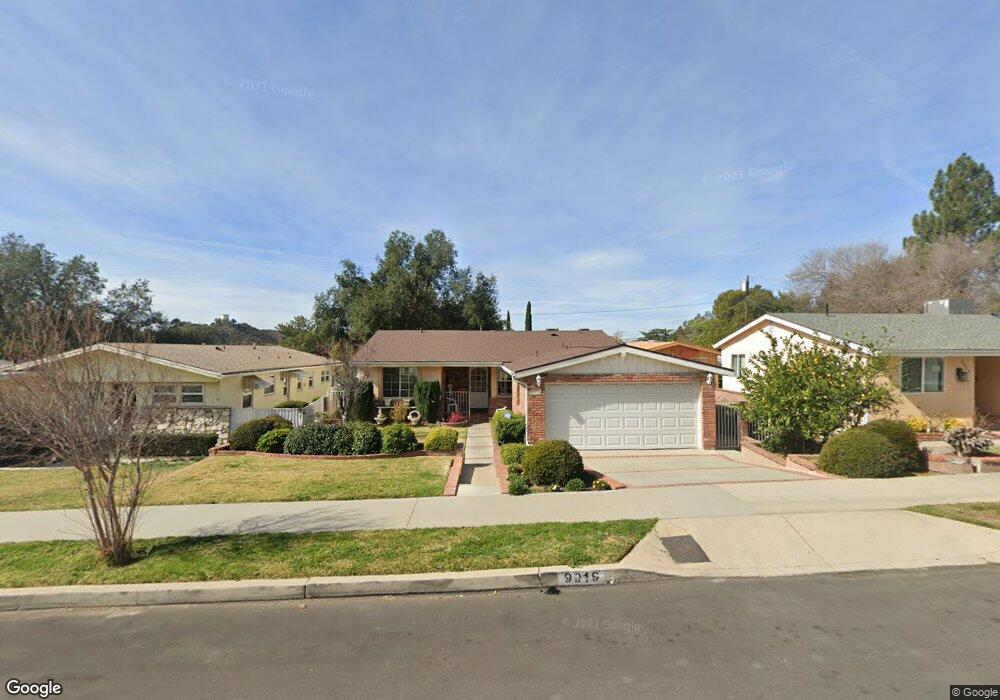
9919 Pali Ave Tujunga, CA 91042
Estimated Value: $1,106,000 - $1,233,000
3
Beds
2
Baths
1,546
Sq Ft
$757/Sq Ft
Est. Value
About This Home
This home is located at 9919 Pali Ave, Tujunga, CA 91042 and is currently estimated at $1,170,470, approximately $757 per square foot. 9919 Pali Ave is a home located in Los Angeles County with nearby schools including Mountain View Elementary School, Mt. Gleason Middle School, and Verdugo Hills Senior High School.
Ownership History
Date
Name
Owned For
Owner Type
Purchase Details
Closed on
Mar 15, 2022
Sold by
Aram S Trust and Mardirosian Azadoohi M
Bought by
Assadourian Family Trust and Assadourian
Current Estimated Value
Purchase Details
Closed on
Feb 21, 2012
Sold by
Mardirosian Azadoohi M
Bought by
Mardirosian Azadoohi M and Arams Trust
Home Financials for this Owner
Home Financials are based on the most recent Mortgage that was taken out on this home.
Original Mortgage
$152,000
Interest Rate
3.84%
Mortgage Type
New Conventional
Purchase Details
Closed on
Feb 3, 2012
Sold by
Johnson Kenneth Lee
Bought by
Mardirosian Azadoohi M
Home Financials for this Owner
Home Financials are based on the most recent Mortgage that was taken out on this home.
Original Mortgage
$152,000
Interest Rate
3.84%
Mortgage Type
New Conventional
Purchase Details
Closed on
Jan 6, 1998
Sold by
Johnson Kenneth D
Bought by
Johnson Kenneth D and Johnson Gloria L
Create a Home Valuation Report for This Property
The Home Valuation Report is an in-depth analysis detailing your home's value as well as a comparison with similar homes in the area
Home Values in the Area
Average Home Value in this Area
Purchase History
| Date | Buyer | Sale Price | Title Company |
|---|---|---|---|
| Assadourian Family Trust | -- | None Listed On Document | |
| Mardirosian Azadoohi M | -- | Fidelity National Title | |
| Mardirosian Azadoohi M | $447,000 | Fidelity National Title | |
| Johnson Kenneth D | -- | -- |
Source: Public Records
Mortgage History
| Date | Status | Borrower | Loan Amount |
|---|---|---|---|
| Previous Owner | Mardirosian Azadoohi M | $152,000 |
Source: Public Records
Tax History
| Year | Tax Paid | Tax Assessment Tax Assessment Total Assessment is a certain percentage of the fair market value that is determined by local assessors to be the total taxable value of land and additions on the property. | Land | Improvement |
|---|---|---|---|---|
| 2025 | $14,916 | $1,241,613 | $795,906 | $445,707 |
| 2024 | $14,916 | $1,217,268 | $780,300 | $436,968 |
| 2023 | $14,626 | $1,193,400 | $765,000 | $428,400 |
| 2022 | $6,391 | $529,066 | $224,527 | $304,539 |
| 2021 | $6,308 | $518,693 | $220,125 | $298,568 |
| 2019 | $6,120 | $503,310 | $213,597 | $289,713 |
| 2018 | $6,005 | $493,442 | $209,409 | $284,033 |
| 2016 | $5,729 | $474,282 | $201,278 | $273,004 |
| 2015 | $5,645 | $467,159 | $198,255 | $268,904 |
| 2014 | $5,668 | $458,009 | $194,372 | $263,637 |
Source: Public Records
Map
Nearby Homes
- 4939 Lowell Ave
- 3953 Santa Carlotta St
- 4922 Lowell Ave
- 9825 Tujunga Canyon Place
- 6432 Creemore Ln
- 6516 Elmo St
- 6436 Day St
- 10157 Durkee Ave
- 6369 W Sister Elsie Dr
- 9659 Amanita Ave
- 0 Blanchard Canyon Unit SR25247538
- 9691 Saluda Ave
- 9722 Tujunga Canyon Blvd
- 4025 Vista Ct
- Lot 54 Blanchard Canyon Rd
- 6125 Sister Elsie Dr
- 6256 Sister Elsie Dr
- 54 Sister Elsie Dr
- 5010 Boston Ave
- 6557 Tokay Rd
Your Personal Tour Guide
Ask me questions while you tour the home.