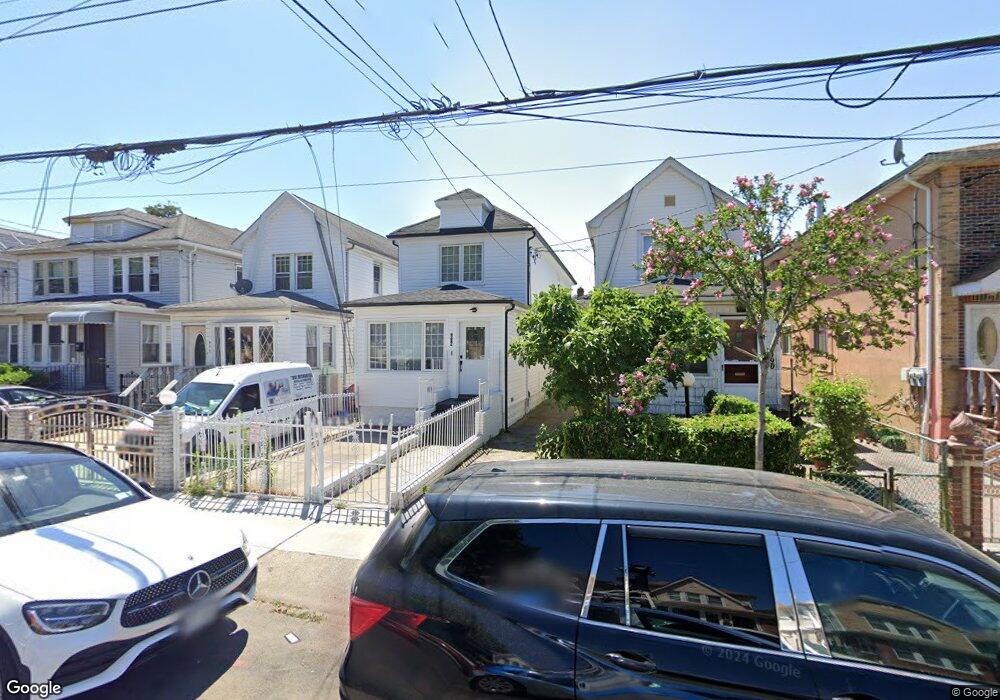
992 E 43rd St Unit Building Brooklyn, NY 11210
Flatlands NeighborhoodEstimated Value: $717,000 - $905,550
Studio
4
Baths
1,414
Sq Ft
$586/Sq Ft
Est. Value
About This Home
This home is located at 992 E 43rd St Unit Building, Brooklyn, NY 11210 and is currently estimated at $828,638, approximately $586 per square foot. 992 E 43rd St Unit Building is a home located in Kings County with nearby schools including P.S. 109, Andries Hudde School, and Christian Heritage Academy.
Ownership History
Date
Name
Owned For
Owner Type
Purchase Details
Closed on
Feb 10, 2022
Sold by
Crown Flatbush Llc
Bought by
Buckner Yvette
Current Estimated Value
Home Financials for this Owner
Home Financials are based on the most recent Mortgage that was taken out on this home.
Original Mortgage
$740,000
Outstanding Balance
$687,146
Interest Rate
3.55%
Mortgage Type
Purchase Money Mortgage
Estimated Equity
$141,492
Purchase Details
Closed on
Jun 24, 2021
Sold by
Browne Jefferson and Browne Nadia
Bought by
Crown Flatbush Llc
Purchase Details
Closed on
Nov 2, 2018
Sold by
Walker Yvonne M
Bought by
Browne Jefferson M and Browne Nadia C
Purchase Details
Closed on
Apr 2, 2001
Sold by
Straight Group Inc
Bought by
Browne Jefferson and Walker Yvonne
Home Financials for this Owner
Home Financials are based on the most recent Mortgage that was taken out on this home.
Original Mortgage
$242,550
Interest Rate
6.88%
Purchase Details
Closed on
Mar 7, 2001
Sold by
Federal Home Loan Mortgage Corporation
Bought by
Straight Group Inc
Home Financials for this Owner
Home Financials are based on the most recent Mortgage that was taken out on this home.
Original Mortgage
$242,550
Interest Rate
6.88%
Create a Home Valuation Report for This Property
The Home Valuation Report is an in-depth analysis detailing your home's value as well as a comparison with similar homes in the area
Home Values in the Area
Average Home Value in this Area
Purchase History
| Date | Buyer | Sale Price | Title Company |
|---|---|---|---|
| Buckner Yvette | $805,000 | -- | |
| Crown Flatbush Llc | $340,000 | -- | |
| Browne Jefferson M | -- | -- | |
| Browne Jefferson | -- | -- | |
| Straight Group Inc | $155,500 | -- |
Source: Public Records
Mortgage History
| Date | Status | Borrower | Loan Amount |
|---|---|---|---|
| Open | Buckner Yvette | $740,000 | |
| Previous Owner | Browne Jefferson | $242,550 |
Source: Public Records
Tax History
| Year | Tax Paid | Tax Assessment Tax Assessment Total Assessment is a certain percentage of the fair market value that is determined by local assessors to be the total taxable value of land and additions on the property. | Land | Improvement |
|---|---|---|---|---|
| 2025 | $6,477 | $49,440 | $8,400 | $41,040 |
| 2024 | $6,477 | $39,060 | $8,400 | $30,660 |
| 2023 | $6,374 | $47,580 | $8,400 | $39,180 |
| 2022 | $5,911 | $37,740 | $8,400 | $29,340 |
| 2021 | $5,583 | $29,160 | $8,400 | $20,760 |
| 2019 | $4,004 | $30,780 | $8,400 | $22,380 |
| 2018 | $5,034 | $26,156 | $6,844 | $19,312 |
| 2017 | $4,731 | $24,676 | $8,365 | $16,311 |
| 2016 | $4,344 | $23,280 | $8,400 | $14,880 |
| 2015 | $2,645 | $22,740 | $9,360 | $13,380 |
| 2014 | $2,645 | $22,394 | $9,217 | $13,177 |
Source: Public Records
Map
Nearby Homes
Your Personal Tour Guide
Ask me questions while you tour the home.