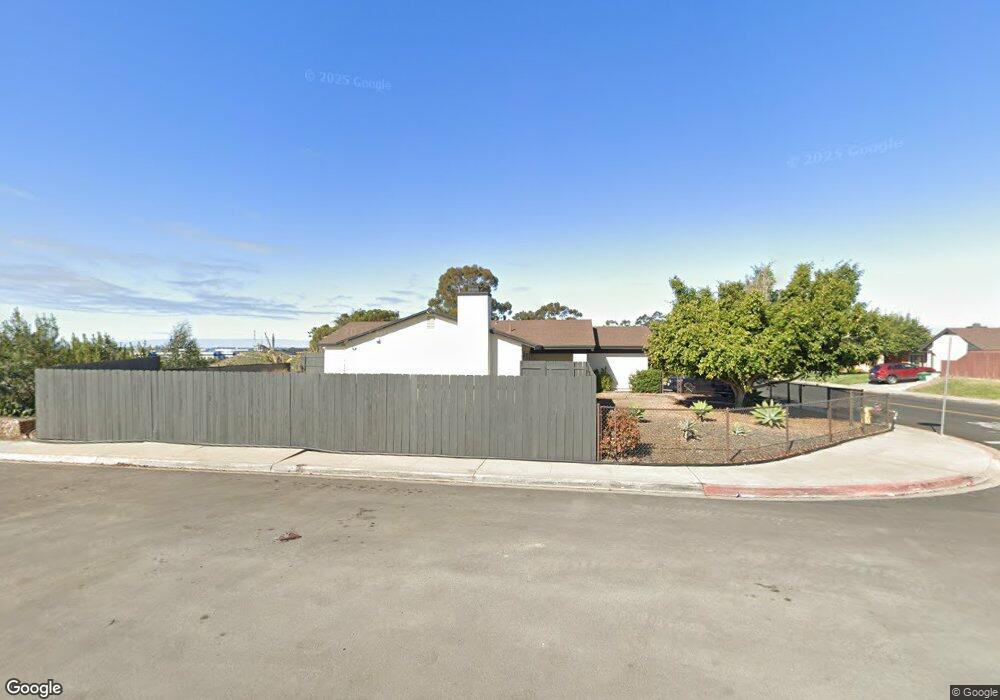
9920 Osgood Way San Diego, CA 92126
Mira Mesa NeighborhoodEstimated Value: $956,000 - $1,114,000
3
Beds
2
Baths
1,353
Sq Ft
$778/Sq Ft
Est. Value
About This Home
This home is located at 9920 Osgood Way, San Diego, CA 92126 and is currently estimated at $1,052,505, approximately $777 per square foot. 9920 Osgood Way is a home located in San Diego County with nearby schools including Jonas Salk Elementary School, Challenger Middle School, and Mira Mesa High School.
Ownership History
Date
Name
Owned For
Owner Type
Purchase Details
Closed on
Feb 15, 2002
Sold by
Henry Susan
Bought by
Kent Michael J and Kent Cathy
Current Estimated Value
Home Financials for this Owner
Home Financials are based on the most recent Mortgage that was taken out on this home.
Original Mortgage
$233,600
Outstanding Balance
$95,771
Interest Rate
6.94%
Estimated Equity
$956,734
Purchase Details
Closed on
Apr 18, 1994
Sold by
Brush Dennis M and Brush Robin G
Bought by
Henry Susan M
Home Financials for this Owner
Home Financials are based on the most recent Mortgage that was taken out on this home.
Original Mortgage
$128,750
Interest Rate
4.25%
Purchase Details
Closed on
May 31, 1988
Purchase Details
Closed on
Oct 16, 1985
Create a Home Valuation Report for This Property
The Home Valuation Report is an in-depth analysis detailing your home's value as well as a comparison with similar homes in the area
Home Values in the Area
Average Home Value in this Area
Purchase History
| Date | Buyer | Sale Price | Title Company |
|---|---|---|---|
| Kent Michael J | $292,000 | California Title Company | |
| Henry Susan M | $146,500 | Southland Title Corporation | |
| -- | $128,000 | -- | |
| -- | $100,000 | -- |
Source: Public Records
Mortgage History
| Date | Status | Borrower | Loan Amount |
|---|---|---|---|
| Open | Kent Michael J | $233,600 | |
| Previous Owner | Henry Susan M | $128,750 | |
| Closed | Kent Michael J | $58,400 |
Source: Public Records
Tax History Compared to Growth
Tax History
| Year | Tax Paid | Tax Assessment Tax Assessment Total Assessment is a certain percentage of the fair market value that is determined by local assessors to be the total taxable value of land and additions on the property. | Land | Improvement |
|---|---|---|---|---|
| 2025 | $5,160 | $431,352 | $295,451 | $135,901 |
| 2024 | $5,160 | $422,895 | $289,658 | $133,237 |
| 2023 | $5,044 | $414,604 | $283,979 | $130,625 |
| 2022 | $4,908 | $406,475 | $278,411 | $128,064 |
| 2021 | $4,872 | $398,505 | $272,952 | $125,553 |
| 2020 | $4,812 | $394,420 | $270,154 | $124,266 |
| 2019 | $4,724 | $386,687 | $264,857 | $121,830 |
| 2018 | $4,417 | $379,106 | $259,664 | $119,442 |
| 2017 | $80 | $371,673 | $254,573 | $117,100 |
| 2016 | $4,236 | $364,386 | $249,582 | $114,804 |
| 2015 | $4,173 | $358,914 | $245,834 | $113,080 |
| 2014 | $4,107 | $351,884 | $241,019 | $110,865 |
Source: Public Records
Map
Nearby Homes
- 8246 Rose Quartz Cir
- 10602 Melogold Way
- 8119 Rose Quartz Cir
- 14115 Angelite Way
- 10423 Newbliss Way
- 13928 Boyden Way
- 13905 Martel Way
- 13907 Martel Way
- 14161 Carnelian Way
- 11050 Solstice Way
- 10422 Adamson Way
- 8021 Rubicon Way
- 10411 Walden Way
- Plan 3 at Meadows District at 3Roots - Dorsey at 3Roots
- Plan 3 at Meadows District at 3Roots - Aero at 3Roots
- Plan 1 at Meadows District at 3Roots - Dorsey at 3Roots
- Plan 1 at Meadows District at 3Roots - Aero at 3Roots
- Plan 2 at Meadows District at 3Roots - Aero at 3Roots
- Plan 2 at Meadows District at 3Roots - Dorsey at 3Roots
- Residence 3 Plan at Meadows District at 3Roots - Hudson at 3Roots
- 9928 Osgood Way
- 9912 Osgood Way
- 9936 Osgood Way
- 9904 Parkdale Ave
- 9942 Osgood Way
- 9933 Osgood Way
- 9925 Osgood Way
- 9941 Osgood Way
- 9914 Parkdale Ave
- 9950 Osgood Way
- 9893 Parkdale Ave
- 9949 Osgood Way
- 9903 Parkdale Ave
- 9924 Parkdale Ave
- 9956 Osgood Way
- 9913 Parkdale Ave
- 9957 Osgood Way
- 9962 Kaufman Way
- 9950 Kaufman Way
- 9934 Parkdale Ave