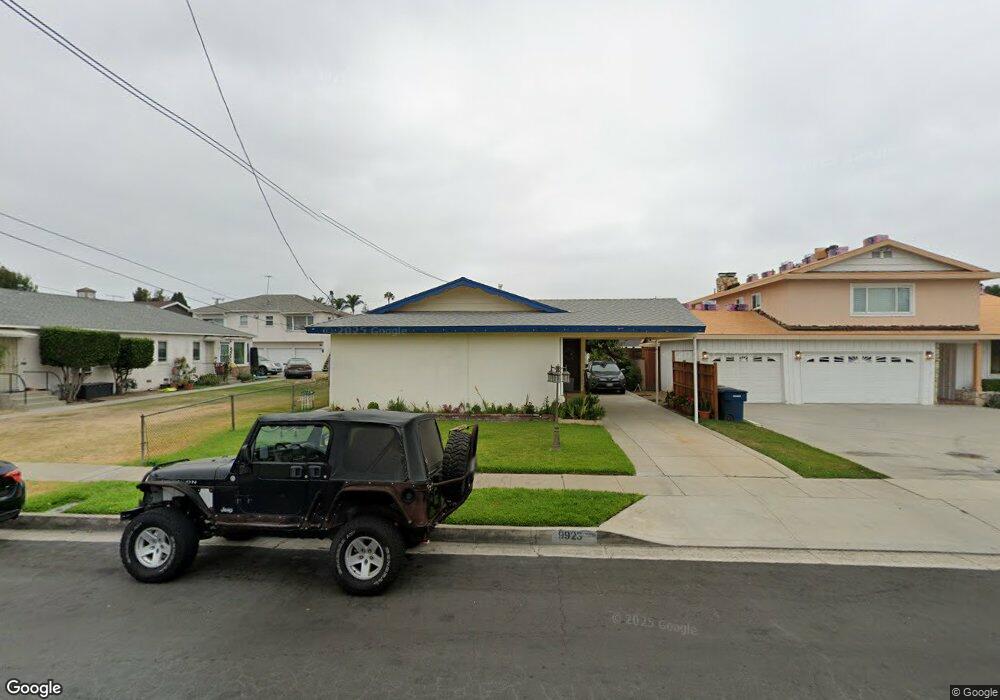
9923 Park St Bellflower, CA 90706
Estimated Value: $936,419 - $992,000
3
Beds
2
Baths
1,816
Sq Ft
$534/Sq Ft
Est. Value
About This Home
This home is located at 9923 Park St, Bellflower, CA 90706 and is currently estimated at $969,605, approximately $533 per square foot. 9923 Park St is a home located in Los Angeles County with nearby schools including Thomas Jefferson Elementary School, Mayfair High School, and St. Bernard School.
Ownership History
Date
Name
Owned For
Owner Type
Purchase Details
Closed on
Jun 2, 2021
Sold by
Wu Jack
Bought by
Jack De Wu Living Trust and De Wu
Current Estimated Value
Purchase Details
Closed on
Mar 6, 2002
Sold by
Reaney Nadine Clare
Bought by
Reaney Michael A
Home Financials for this Owner
Home Financials are based on the most recent Mortgage that was taken out on this home.
Original Mortgage
$250,000
Interest Rate
6.99%
Purchase Details
Closed on
Feb 25, 2002
Sold by
Wu Emily
Bought by
Wu Jack
Home Financials for this Owner
Home Financials are based on the most recent Mortgage that was taken out on this home.
Original Mortgage
$250,000
Interest Rate
6.99%
Purchase Details
Closed on
Feb 14, 2002
Sold by
Reaney Michael A and Reaney Dayton L
Bought by
Wu Jack
Home Financials for this Owner
Home Financials are based on the most recent Mortgage that was taken out on this home.
Original Mortgage
$250,000
Interest Rate
6.99%
Purchase Details
Closed on
Dec 3, 1999
Sold by
Marie J Reaney Trust and Dayton L
Bought by
Reaney Dayton L
Create a Home Valuation Report for This Property
The Home Valuation Report is an in-depth analysis detailing your home's value as well as a comparison with similar homes in the area
Home Values in the Area
Average Home Value in this Area
Purchase History
| Date | Buyer | Sale Price | Title Company |
|---|---|---|---|
| Jack De Wu Living Trust | -- | None Listed On Document | |
| Reaney Michael A | -- | Gateway Title | |
| Wu Jack | -- | Gateway Title | |
| Wu Jack | $280,000 | Gateway Title Company | |
| Reaney Dayton L | -- | -- |
Source: Public Records
Mortgage History
| Date | Status | Borrower | Loan Amount |
|---|---|---|---|
| Previous Owner | Wu Jack | $250,000 |
Source: Public Records
Tax History
| Year | Tax Paid | Tax Assessment Tax Assessment Total Assessment is a certain percentage of the fair market value that is determined by local assessors to be the total taxable value of land and additions on the property. | Land | Improvement |
|---|---|---|---|---|
| 2025 | $5,090 | $413,622 | $227,346 | $186,276 |
| 2024 | $5,090 | $405,513 | $222,889 | $182,624 |
| 2023 | $4,889 | $397,563 | $218,519 | $179,044 |
| 2022 | $4,800 | $389,769 | $214,235 | $175,534 |
| 2021 | $4,696 | $382,128 | $210,035 | $172,093 |
| 2019 | $4,573 | $370,796 | $203,806 | $166,990 |
| 2018 | $4,384 | $363,526 | $199,810 | $163,716 |
| 2016 | $4,196 | $349,411 | $192,052 | $157,359 |
| 2015 | $4,109 | $344,164 | $189,168 | $154,996 |
| 2014 | $4,054 | $337,423 | $185,463 | $151,960 |
Source: Public Records
Map
Nearby Homes
- 9929 Park St
- 16924 Bixby Ave
- 9725 Arkansas St
- 10117 Palm St
- 16712 Bellflower Blvd
- 10241 Flora Vista St
- 16822 Ardmore Ave
- 16919 Ardmore Ave
- 16414 Cornuta Ave Unit 8
- 16331 Cornuta Ave Unit E
- 9921 Flora Vista St Unit 5
- 9921 Flora Vista St Unit 6
- 9559 Flower St
- 9545 Flower St
- 10405 Park St
- 10292 Artesia Blvd
- 17046 Clark Ave
- 9520 Mayne St
- 9527 Los Angeles St
- 10358 Trabuco St
Your Personal Tour Guide
Ask me questions while you tour the home.