9924 Inniskillin Ave SW Albuquerque, NM 87121
Southwest Heights NeighborhoodEstimated Value: $348,000 - $375,000
4
Beds
2
Baths
2,923
Sq Ft
$123/Sq Ft
Est. Value
About This Home
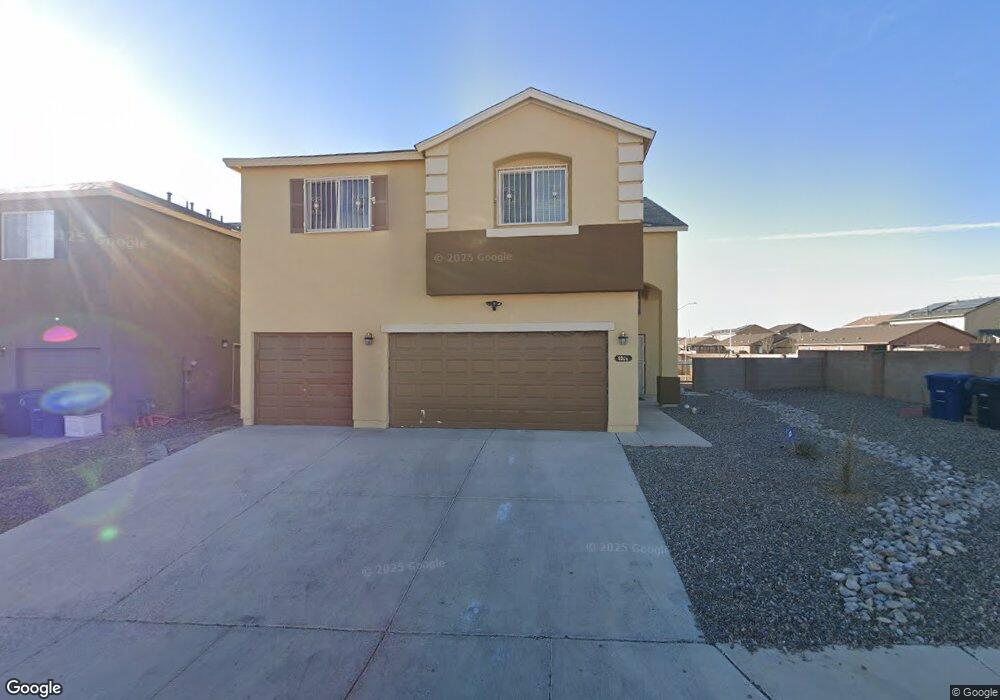
This home is located at 9924 Inniskillin Ave SW, Albuquerque, NM 87121 and is currently estimated at $360,225, approximately $123 per square foot. 9924 Inniskillin Ave SW is a home located in Bernalillo County with nearby schools including Rudolfo Anaya Elementary School, Tony Hillerman Middle School, and Atrisco Heritage Academy High School.
Ownership History
Date
Name
Owned For
Owner Type
Purchase Details
Closed on
Aug 14, 2009
Sold by
Evans Bonnie
Bought by
Brown Angela G
Current Estimated Value
Home Financials for this Owner
Home Financials are based on the most recent Mortgage that was taken out on this home.
Original Mortgage
$23,850
Outstanding Balance
$6,364
Interest Rate
4.5%
Mortgage Type
Purchase Money Mortgage
Estimated Equity
$353,861
Purchase Details
Closed on
Apr 30, 2009
Sold by
Garcia Eddie
Bought by
Evans Bonnie and 9924 Inniskillin Trust
Purchase Details
Closed on
Aug 24, 2006
Sold by
Longford At Arrowwood Llc
Bought by
Garcia Eddie S
Home Financials for this Owner
Home Financials are based on the most recent Mortgage that was taken out on this home.
Original Mortgage
$238,590
Interest Rate
10.5%
Mortgage Type
Purchase Money Mortgage
Create a Home Valuation Report for This Property
The Home Valuation Report is an in-depth analysis detailing your home's value as well as a comparison with similar homes in the area
Home Values in the Area
Average Home Value in this Area
Purchase History
| Date | Buyer | Sale Price | Title Company |
|---|---|---|---|
| Brown Angela G | -- | Fidelity Natl Title Ins Co | |
| Evans Bonnie | -- | Fidelity Natl Title Ins Co | |
| Evans Bonnie | -- | None Available | |
| Garcia Eddie S | -- | Landamerica New Mexico Title |
Source: Public Records
Mortgage History
| Date | Status | Borrower | Loan Amount |
|---|---|---|---|
| Open | Evans Bonnie | $23,850 | |
| Open | Brown Angela G | $127,200 | |
| Previous Owner | Garcia Eddie S | $238,590 |
Source: Public Records
Tax History Compared to Growth
Tax History
| Year | Tax Paid | Tax Assessment Tax Assessment Total Assessment is a certain percentage of the fair market value that is determined by local assessors to be the total taxable value of land and additions on the property. | Land | Improvement |
|---|---|---|---|---|
| 2025 | $2,879 | $70,276 | $13,436 | $56,840 |
| 2024 | $2,879 | $68,230 | $13,045 | $55,185 |
| 2023 | $2,831 | $66,243 | $12,665 | $53,578 |
| 2022 | $2,735 | $64,313 | $12,296 | $52,017 |
| 2021 | $2,644 | $62,440 | $11,938 | $50,502 |
| 2020 | $2,600 | $60,622 | $11,591 | $49,031 |
| 2019 | $2,524 | $58,858 | $11,254 | $47,604 |
| 2018 | $2,434 | $58,858 | $11,254 | $47,604 |
| 2017 | $2,359 | $57,143 | $10,926 | $46,217 |
| 2016 | $2,292 | $53,864 | $10,299 | $43,565 |
| 2015 | $52,295 | $52,295 | $9,999 | $42,296 |
| 2014 | $2,157 | $52,795 | $9,999 | $42,796 |
| 2013 | -- | $53,295 | $9,999 | $43,296 |
Source: Public Records
Map
Nearby Homes
- 9909 Shiraz Rd SW
- 10040 Artemsia Ave SW
- 10039 Andrews Ave SW
- 9808 Farinosa Ave SW
- 10224 Cristalino Rd SW
- 2920 Gault Trail SW
- 9908 Sacate Blanco Ave SW
- 10504 Serafina SW
- 10508 Serafina Way SW
- 10501 Serafina Way SW
- 10528 Caresso Loop SW
- 10512 Serafina Way SW
- 10505 Serafina Way SW
- 10509 Serafina Way SW
- 10319 Cristalino Rd SW
- 10520 Serafina Way SW
- 10517 Serafina Way SW
- 10524 Serafina Way SW
- 10521 Serafina Way SW
- 10525 Serafina Way SW
- 9920 Inniskillin Ave SW
- 9916 Inniskillin Ave SW
- 9916 Inniskillin Ave SW
- 9916 Inniskillin Ave SW
- 2847 Cabernet St SW
- 9912 Inniskillin Ave SW
- 10200 Chianti Ave SW
- 2845 Cabernet St SW
- 9919 Artemsia Ave SW
- 9915 Artemsia Ave SW
- 9908 Inniskillin Ave SW
- 9909 Artemsia Ave SW
- 2856 Baco Noir Dr SW
- 9923 Inniskillin Ave SW
- 2843 Cabernet St SW
- 10204 Chianti Ave SW
- 2854 Baco Noir Dr SW
- 9905 Artemsia Ave SW
- 9919 Inniskillin Ave SW
- 10001 Artemsia Ave SW