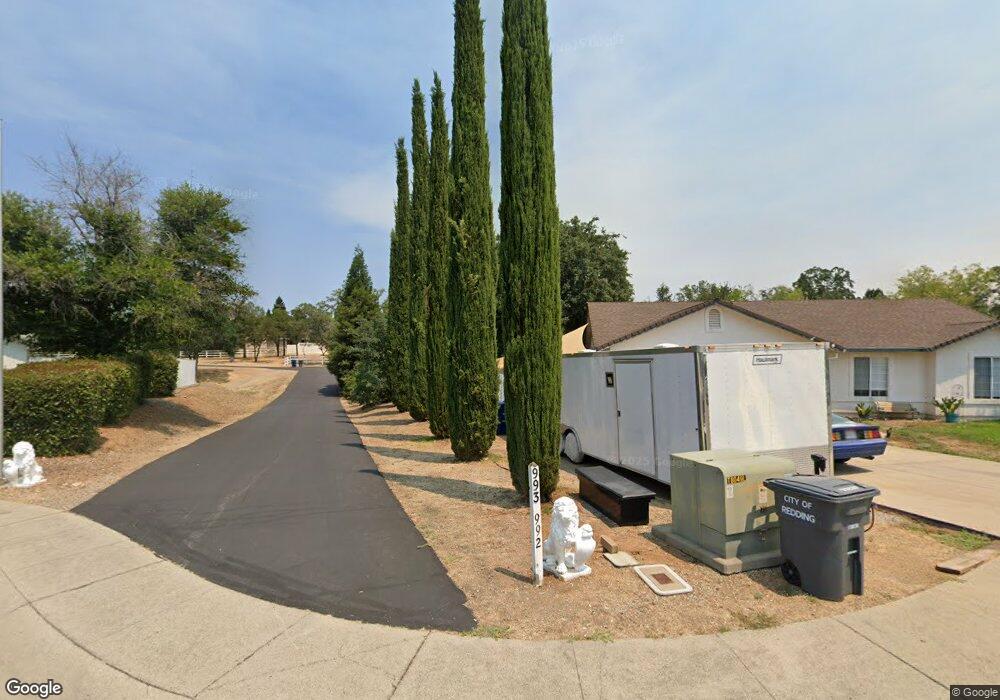
993 Paramount Way Unit 5 Redding, CA 96003
Hawley NeighborhoodEstimated Value: $409,000 - $452,000
3
Beds
2
Baths
1,679
Sq Ft
$258/Sq Ft
Est. Value
About This Home
This home is located at 993 Paramount Way Unit 5, Redding, CA 96003 and is currently estimated at $432,937, approximately $257 per square foot. 993 Paramount Way Unit 5 is a home located in Shasta County with nearby schools including Shasta View Academy, Bethel Christian School, and Country Christian School.
Ownership History
Date
Name
Owned For
Owner Type
Purchase Details
Closed on
Jun 20, 2025
Sold by
Mcgrath Margaret
Bought by
Margaret Mcgrath Trust and Mcgrath
Current Estimated Value
Purchase Details
Closed on
Jul 23, 2007
Sold by
Mccorath Daniel
Bought by
Mccorth Margaret
Purchase Details
Closed on
Jun 26, 2003
Sold by
Mcgrath Daniel G
Bought by
Mcgrath Margaret M
Purchase Details
Closed on
Jul 23, 2002
Sold by
Mcgrath Agnieszka
Bought by
Mcgrath Margaret
Purchase Details
Closed on
Apr 25, 2001
Sold by
Rieger Jeffrey Hoover
Bought by
Mcgrath Daniel G and Mcgrath Margaret M
Home Financials for this Owner
Home Financials are based on the most recent Mortgage that was taken out on this home.
Original Mortgage
$140,000
Interest Rate
6.92%
Create a Home Valuation Report for This Property
The Home Valuation Report is an in-depth analysis detailing your home's value as well as a comparison with similar homes in the area
Home Values in the Area
Average Home Value in this Area
Purchase History
| Date | Buyer | Sale Price | Title Company |
|---|---|---|---|
| Margaret Mcgrath Trust | -- | None Listed On Document | |
| Mccorth Margaret | -- | None Available | |
| Mcgrath Margaret M | -- | -- | |
| Mcgrath Margaret | -- | None Available | |
| Mcgrath Daniel G | $175,000 | Fidelity National Title Co |
Source: Public Records
Mortgage History
| Date | Status | Borrower | Loan Amount |
|---|---|---|---|
| Previous Owner | Mcgrath Daniel G | $140,000 |
Source: Public Records
Tax History
| Year | Tax Paid | Tax Assessment Tax Assessment Total Assessment is a certain percentage of the fair market value that is determined by local assessors to be the total taxable value of land and additions on the property. | Land | Improvement |
|---|---|---|---|---|
| 2025 | $4,226 | $370,186 | $96,751 | $273,435 |
| 2024 | $4,145 | $362,928 | $94,854 | $268,074 |
| 2023 | $4,145 | $355,813 | $92,995 | $262,818 |
| 2022 | $4,017 | $348,837 | $91,172 | $257,665 |
| 2021 | $3,995 | $341,998 | $89,385 | $252,613 |
| 2020 | $3,959 | $338,492 | $88,469 | $250,023 |
| 2019 | $3,839 | $331,856 | $86,735 | $245,121 |
| 2018 | $3,856 | $325,350 | $85,035 | $240,315 |
| 2017 | $3,588 | $305,000 | $70,000 | $235,000 |
| 2016 | $3,326 | $290,000 | $65,000 | $225,000 |
| 2015 | $3,017 | $265,000 | $55,000 | $210,000 |
| 2014 | $2,758 | $240,000 | $40,000 | $200,000 |
Source: Public Records
Map
Nearby Homes
- 19424 Posey Ln
- 1102 Hope Ln
- 19219 Nike Ct
- 19340 Carnegie Ct
- 11632 Ridgewood Rd
- 61 Tidmore Ln
- 19011 Freda Ln
- 948 & 950 Hawley
- 1546 Gold Hills Dr
- 2192 Princeton Way
- 2199 Princeton Way
- 332 Franciscan Trail
- 5961 Sierra Dr
- 2132 Hope Ln
- 5976 Sierra Dr
- 5890 Shadow Glen Dr
- 6260 Carmel Dr
- 662 Ansley Ct
- 1779 Player Ct
- 000 Wintu Way
- 993 Paramount Way Unit 1
- 11515 Amir Ct
- 971 Paramount Way
- 949 Paramount Way
- 974 Paramount Way
- 11516 Amir Ct
- 11510 Vista Del Rio
- 11519 Amir Ct
- 11520 Amir Ct
- 956 Paramount Way
- 11521 Norton Ln
- 11522 Vista Del Rio
- 920 Paramount Way
- 11527 Amir Ct
- 992 Paramount Way
- 938 Paramount Way
- 11523 Norton Ln Unit 1
- 11523 Norton Ln
- 11528 Amir Ct
- 11528 Vista Del Rio
Your Personal Tour Guide
Ask me questions while you tour the home.