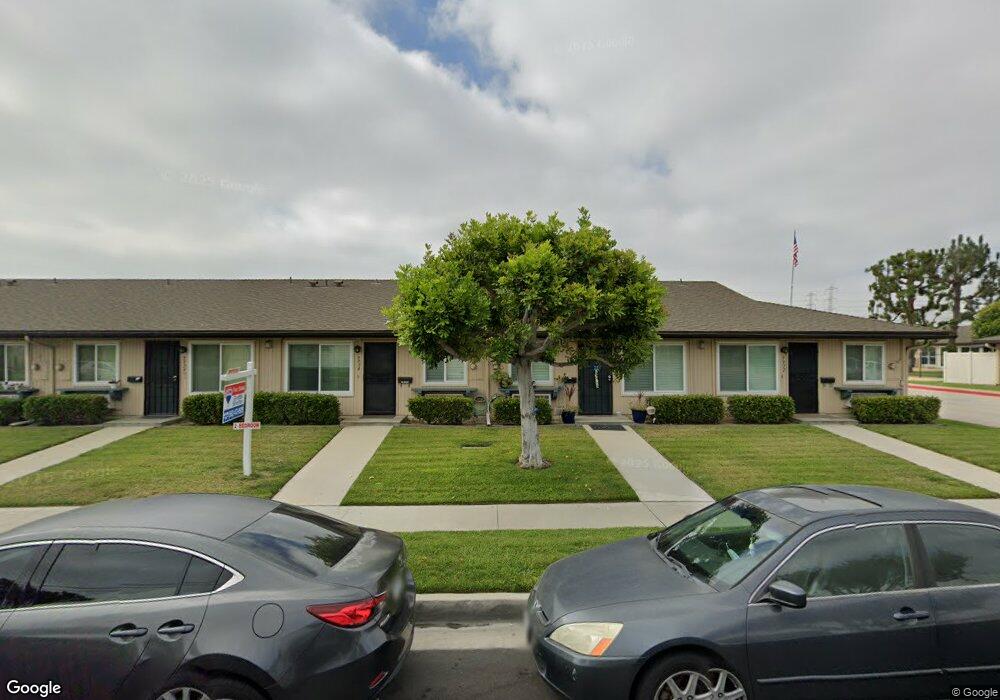
9932 1/2 Cedar St Bellflower, CA 90706
Estimated Value: $386,000 - $432,632
2
Beds
1
Bath
800
Sq Ft
$517/Sq Ft
Est. Value
About This Home
This home is located at 9932 1/2 Cedar St, Bellflower, CA 90706 and is currently estimated at $413,908, approximately $517 per square foot. 9932 1/2 Cedar St is a home located in Los Angeles County with nearby schools including Thomas Jefferson Elementary School, Mayfair High School, and St. Bernard School.
Ownership History
Date
Name
Owned For
Owner Type
Purchase Details
Closed on
May 21, 2015
Sold by
Wong David
Bought by
Skourtas Tonay A and Skourtas Angelique Marie
Current Estimated Value
Purchase Details
Closed on
Nov 27, 2007
Sold by
Cox Sandford C and Cox Sandford C
Bought by
Wong David
Home Financials for this Owner
Home Financials are based on the most recent Mortgage that was taken out on this home.
Original Mortgage
$178,500
Interest Rate
6.2%
Mortgage Type
Purchase Money Mortgage
Purchase Details
Closed on
Sep 12, 2006
Sold by
Cox Florence M
Bought by
Cox Florence M and Sandford C & Florence M Cox Revocable Li
Purchase Details
Closed on
Jul 16, 2001
Sold by
Vandermeer Samuel J and Vandermeer Sharlene
Bought by
Cox Florence M
Purchase Details
Closed on
Apr 1, 1995
Sold by
Vandermeer Anna J and Vandermeer Samuel J
Bought by
Vandermeer Anna J
Create a Home Valuation Report for This Property
The Home Valuation Report is an in-depth analysis detailing your home's value as well as a comparison with similar homes in the area
Home Values in the Area
Average Home Value in this Area
Purchase History
| Date | Buyer | Sale Price | Title Company |
|---|---|---|---|
| Skourtas Tonay A | $193,000 | Fidelity Sherman Oaks | |
| Wong David | $238,000 | Southland Title Corporation | |
| Wong David | -- | Southland Title Corporation | |
| Cox Florence M | -- | None Available | |
| Cox Florence M | $94,000 | Lawyers Title Company | |
| Vandermeer Anna J | -- | -- |
Source: Public Records
Mortgage History
| Date | Status | Borrower | Loan Amount |
|---|---|---|---|
| Previous Owner | Wong David | $178,500 |
Source: Public Records
Tax History
| Year | Tax Paid | Tax Assessment Tax Assessment Total Assessment is a certain percentage of the fair market value that is determined by local assessors to be the total taxable value of land and additions on the property. | Land | Improvement |
|---|---|---|---|---|
| 2025 | $2,833 | $228,462 | $114,231 | $114,231 |
| 2024 | $2,833 | $223,984 | $111,992 | $111,992 |
| 2023 | $2,722 | $219,594 | $109,797 | $109,797 |
| 2022 | $2,669 | $215,290 | $107,645 | $107,645 |
| 2021 | $2,612 | $211,070 | $105,535 | $105,535 |
| 2019 | $2,542 | $204,810 | $102,405 | $102,405 |
| 2018 | $2,473 | $200,796 | $100,398 | $100,398 |
| 2016 | $2,368 | $193,000 | $96,500 | $96,500 |
| 2015 | $2,438 | $194,000 | $57,100 | $136,900 |
| 2014 | -- | $142,000 | $41,800 | $100,200 |
Source: Public Records
Map
Nearby Homes
- 6127 Adenmoor Ave
- 6118 Amos Ave
- 10292 Artesia Blvd
- 6049 Autry Ave
- 6007 Coldbrook Ave
- 6157 Carpintero Ave
- 5932 Eastbrook Ave
- 5919 Bellflower Blvd
- 17924 Redwood Ave
- 9725 Arkansas St
- 16924 Bixby Ave
- 5711 Rocket St
- 5942 Fidler Ave
- 9319 Cedar St Unit C
- 10405 Park St
- 16919 Ardmore Ave
- 9261 Cedar St
- 5851 Premiere Ave
- 16822 Ardmore Ave
- 10241 Flora Vista St
- 9932 Cedar St Unit 1/2
- 9932 Cedar St
- 9934 1/2 Cedar St
- 9936 Cedar St
- 9936 1/2 Cedar St
- 9906 1/2 Cedar St
- 9918 Cedar St
- 9906 Cedar St
- 9918 1/2 Cedar St
- 9938 Cedar St
- 9904 1/2 Cedar St
- 9930 3/4 Cedar St
- 9904 Cedar St
- 9930 Cedar St Unit 1/2
- 9930 Cedar St
- 9930 1/2 Cedar St
- 9920 1/2 Cedar St
- 9920 Cedar St
- 9902 1/2 Cedar St
- 9928 1/4 Cedar St
Your Personal Tour Guide
Ask me questions while you tour the home.