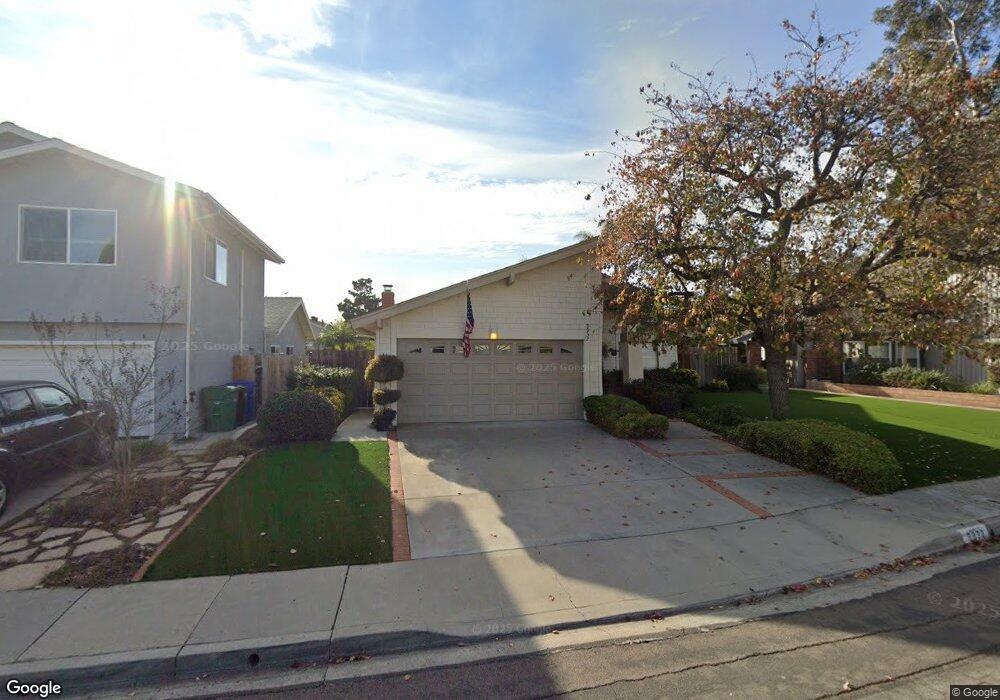
9932 Bourbon Ct San Diego, CA 92131
Scripps Ranch NeighborhoodEstimated Value: $1,220,022 - $1,477,000
4
Beds
2
Baths
1,845
Sq Ft
$736/Sq Ft
Est. Value
About This Home
This home is located at 9932 Bourbon Ct, San Diego, CA 92131 and is currently estimated at $1,357,506, approximately $735 per square foot. 9932 Bourbon Ct is a home located in San Diego County with nearby schools including Miramar Ranch Elementary School, Thurgood Marshall Middle School, and Scripps Ranch High School.
Ownership History
Date
Name
Owned For
Owner Type
Purchase Details
Closed on
Aug 9, 2011
Sold by
Zides Daniel E and Zides Gail E
Bought by
Zides Daniel E and Zides Gail E
Current Estimated Value
Home Financials for this Owner
Home Financials are based on the most recent Mortgage that was taken out on this home.
Original Mortgage
$35,200
Interest Rate
4.46%
Mortgage Type
New Conventional
Purchase Details
Closed on
Mar 7, 2008
Sold by
Zides Daniel E and Zides Gail E
Bought by
Zides Daniel E and Zides Gail E
Home Financials for this Owner
Home Financials are based on the most recent Mortgage that was taken out on this home.
Original Mortgage
$42,000
Interest Rate
5.16%
Mortgage Type
New Conventional
Purchase Details
Closed on
Aug 8, 2000
Sold by
Zides Daniel E and Zides Gail E
Bought by
Zides Daniel E and Zides Gail E
Create a Home Valuation Report for This Property
The Home Valuation Report is an in-depth analysis detailing your home's value as well as a comparison with similar homes in the area
Home Values in the Area
Average Home Value in this Area
Purchase History
| Date | Buyer | Sale Price | Title Company |
|---|---|---|---|
| Zides Daniel E | -- | Accommodation | |
| Zides Daniel E | -- | Stewart Title Of California | |
| Zides Daniel E | -- | Accommodation | |
| Zides Daniel E | -- | Stewart Title Of California | |
| Zides Daniel E | -- | -- | |
| Zides Daniel E | -- | -- |
Source: Public Records
Mortgage History
| Date | Status | Borrower | Loan Amount |
|---|---|---|---|
| Closed | Zides Daniel E | $35,200 | |
| Closed | Zides Daniel E | $42,000 |
Source: Public Records
Tax History Compared to Growth
Tax History
| Year | Tax Paid | Tax Assessment Tax Assessment Total Assessment is a certain percentage of the fair market value that is determined by local assessors to be the total taxable value of land and additions on the property. | Land | Improvement |
|---|---|---|---|---|
| 2025 | $1,561 | $113,652 | $19,603 | $94,049 |
| 2024 | $1,561 | $111,424 | $19,219 | $92,205 |
| 2023 | $1,518 | $109,241 | $18,843 | $90,398 |
| 2022 | $1,467 | $107,100 | $18,474 | $88,626 |
| 2021 | $1,444 | $105,001 | $18,112 | $86,889 |
| 2020 | $1,425 | $103,926 | $17,927 | $85,999 |
| 2019 | $1,399 | $101,889 | $17,576 | $84,313 |
| 2018 | $1,313 | $99,892 | $17,232 | $82,660 |
| 2017 | $80 | $97,935 | $16,895 | $81,040 |
| 2016 | $1,256 | $96,015 | $16,564 | $79,451 |
| 2015 | $1,235 | $94,574 | $16,316 | $78,258 |
| 2014 | $1,216 | $92,723 | $15,997 | $76,726 |
Source: Public Records
Map
Nearby Homes
- 9950 Dichondra Place
- 10831 Ironwood Rd
- 10265 Aviary Dr
- 10466 Ridgewater Ln
- 10473 Crosscreek Terrace
- 10535 Arbor Park Place
- 10545 Caminito Memosac
- 10415 Mesa Madera Dr
- 10565 Caminito Basswood
- 10594 Rookwood Dr
- 10497 Caminito Mayten
- 11646 La Colina Rd
- 10447 Caminito Banyon
- 10374 Caminito Banyon Unit U140
- 10280 Caminito Rio Branco
- 10405 White Birch Dr
- 10343 Caminito Aralia Unit 64
- 10333 Caminito Aralia Unit 70
- 10616 Falcon Rim Point
- 11787 La Colina Rd
- 9926 Bourbon Ct
- 9938 Bourbon Ct
- 9977 Courtyard Dr
- 9983 Courtyard Dr
- 9920 Bourbon Ct
- 9971 Courtyard Dr
- 9935 Bourbon Ct
- 9961 Courtyard Dr
- 9914 Bourbon Ct
- 9950 Bourbon Ct
- 9989 Courtyard Dr
- 9921 Bourbon Ct
- 9949 Bourbon Ct
- 9956 Bourbon Ct
- 9953 Courtyard Dr
- 11106 Ironwood Rd
- 9906 Bourbon Ct
- 9995 Courtyard Dr
- 11118 Ironwood Rd
- 9959 Bourbon Ct