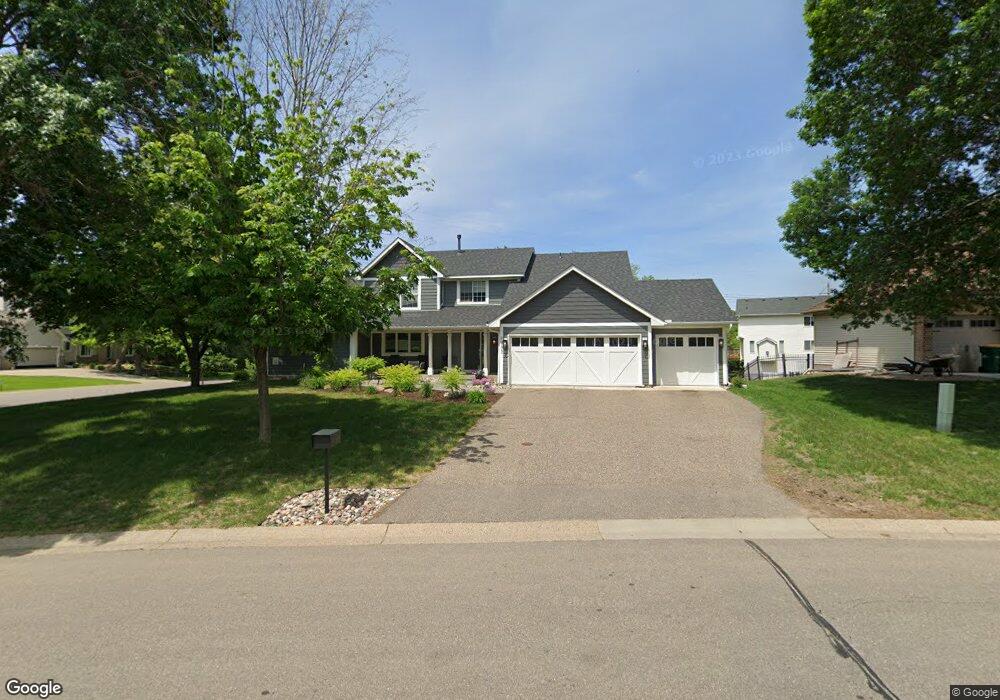
9933 172nd St W Lakeville, MN 55044
Estimated Value: $624,000 - $741,000
4
Beds
3
Baths
3,040
Sq Ft
$221/Sq Ft
Est. Value
About This Home
This home is located at 9933 172nd St W, Lakeville, MN 55044 and is currently estimated at $670,918, approximately $220 per square foot. 9933 172nd St W is a home located in Dakota County with nearby schools including Huddleston Elementary School, Kenwood Trail Middle School, and Lakeville North High School.
Ownership History
Date
Name
Owned For
Owner Type
Purchase Details
Closed on
Oct 31, 2008
Sold by
Ronel Corp
Bought by
Ruppert Joshua D and Ruppert Deborah
Current Estimated Value
Home Financials for this Owner
Home Financials are based on the most recent Mortgage that was taken out on this home.
Original Mortgage
$310,351
Outstanding Balance
$202,915
Interest Rate
6%
Mortgage Type
FHA
Estimated Equity
$468,003
Purchase Details
Closed on
Jul 15, 2008
Sold by
Wells Fargo Bank
Bought by
Ronel Corp
Purchase Details
Closed on
Aug 19, 2004
Sold by
Oneil Gary F and Oneil Carolyn M
Bought by
Jensen James W
Purchase Details
Closed on
Oct 15, 1999
Sold by
Key-Land Homes
Bought by
Oneil Gary F and Oneil Carolyn M
Purchase Details
Closed on
Jun 21, 1999
Sold by
Falvey James E and Falvey Cynthia M
Bought by
Key & Land Homes
Create a Home Valuation Report for This Property
The Home Valuation Report is an in-depth analysis detailing your home's value as well as a comparison with similar homes in the area
Home Values in the Area
Average Home Value in this Area
Purchase History
| Date | Buyer | Sale Price | Title Company |
|---|---|---|---|
| Ruppert Joshua D | $316,000 | -- | |
| Ronel Corp | $149,900 | -- | |
| Jensen James W | $340,000 | -- | |
| Oneil Gary F | $205,400 | -- | |
| Key & Land Homes | $61,900 | -- |
Source: Public Records
Mortgage History
| Date | Status | Borrower | Loan Amount |
|---|---|---|---|
| Open | Ruppert Joshua D | $310,351 |
Source: Public Records
Tax History Compared to Growth
Tax History
| Year | Tax Paid | Tax Assessment Tax Assessment Total Assessment is a certain percentage of the fair market value that is determined by local assessors to be the total taxable value of land and additions on the property. | Land | Improvement |
|---|---|---|---|---|
| 2024 | $8,118 | $654,100 | $124,000 | $530,100 |
| 2023 | $8,118 | $687,400 | $123,600 | $563,800 |
| 2022 | $6,232 | $671,400 | $123,200 | $548,200 |
| 2021 | $5,148 | $506,500 | $115,500 | $391,000 |
| 2020 | $4,768 | $401,100 | $110,000 | $291,100 |
| 2019 | $4,242 | $353,100 | $104,700 | $248,400 |
| 2018 | $4,209 | $323,900 | $99,700 | $224,200 |
| 2017 | $3,778 | $314,500 | $94,900 | $219,600 |
| 2016 | $3,810 | $302,400 | $90,400 | $212,000 |
| 2015 | $3,611 | $279,841 | $84,366 | $195,475 |
| 2014 | -- | $276,680 | $82,043 | $194,637 |
| 2013 | -- | $260,984 | $74,594 | $186,390 |
Source: Public Records
Map
Nearby Homes
- 9924 172nd St W
- 17152 Isleton Ave
- 17408 Ixonia Path
- 9638 172nd St W
- 9957 171st St W
- 9780 170th St W
- 17475 Jaguar Path
- 9559 173rd St W
- 10025 170th St W
- 16825 Jackpine Trail
- 16812 Jalisco Terrace E
- 17128 Jonquil Ave
- 17876 Ixonia Ave
- 17500 Jonquil Ave
- 16706 Innsbrook Dr
- 10185 Upper 178th St W
- Charleswood II & III Plan at Pheasant Run
- The Arlington Plan at Pheasant Run
- Lincoln II Plan at Pheasant Run
- Newbury Plan at Knob Hill
- 9909 172nd St W
- 17183 Jackpine Trail
- 17165 Jackrabbit Path
- 17150 Jackrabbit Path
- 17240 Jade Ct
- 17171 Jackpine Trail
- 17196 Jackpine Trail
- 17130 Jackpine Ct
- 17188 Jackpine Trail
- 17170 Jackrabbit Path
- 17250 Jade Ct
- 17175 Jackrabbit Path
- 9879 Upper 173rd Ct W
- 9884 172nd St W
- 17180 Jackpine Trail
- 9863 Upper 173rd Ct W
- 9861 172nd St W
- 17190 Jackrabbit Path
- 9849 Upper 173rd Ct W
- 17185 Jackrabbit Path