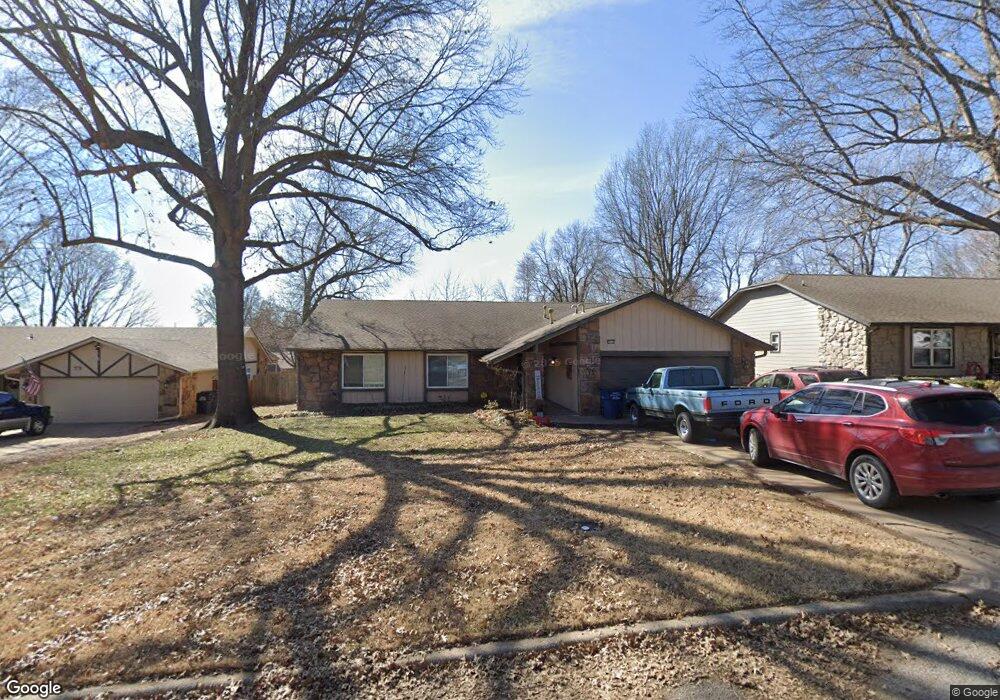
9934 E 115th St S Bixby, OK 74008
North Bixby NeighborhoodEstimated Value: $259,000 - $276,000
4
Beds
2
Baths
1,935
Sq Ft
$138/Sq Ft
Est. Value
About This Home
This home is located at 9934 E 115th St S, Bixby, OK 74008 and is currently estimated at $267,122, approximately $138 per square foot. 9934 E 115th St S is a home located in Tulsa County with nearby schools including Bixby East Elementary, Bixby Middle School, and Bixby High School.
Ownership History
Date
Name
Owned For
Owner Type
Purchase Details
Closed on
May 19, 2016
Sold by
Hamra Joseph H and Hamra Brittany
Bought by
Neasby Jimmy and Neasby Amber
Current Estimated Value
Home Financials for this Owner
Home Financials are based on the most recent Mortgage that was taken out on this home.
Original Mortgage
$170,356
Outstanding Balance
$134,566
Interest Rate
3.59%
Mortgage Type
FHA
Estimated Equity
$132,556
Purchase Details
Closed on
Jul 28, 2010
Sold by
Church Betty L
Bought by
Hamra Joseph H
Home Financials for this Owner
Home Financials are based on the most recent Mortgage that was taken out on this home.
Original Mortgage
$78,800
Interest Rate
4.76%
Mortgage Type
New Conventional
Purchase Details
Closed on
Feb 12, 2009
Sold by
Church Troy
Bought by
Church Betty L
Purchase Details
Closed on
Nov 29, 1999
Sold by
Sterling Richard Joe and Sterling Janna Rae
Bought by
Church Troy Wayne and Church Julie Dawn
Purchase Details
Closed on
Mar 1, 1994
Create a Home Valuation Report for This Property
The Home Valuation Report is an in-depth analysis detailing your home's value as well as a comparison with similar homes in the area
Home Values in the Area
Average Home Value in this Area
Purchase History
| Date | Buyer | Sale Price | Title Company |
|---|---|---|---|
| Neasby Jimmy | $173,500 | Guaranty Abstract Co | |
| Hamra Joseph H | $98,500 | Executives Title & Escrow Co | |
| Church Betty L | -- | None Available | |
| Church Troy Wayne | -- | -- | |
| -- | $56,000 | -- |
Source: Public Records
Mortgage History
| Date | Status | Borrower | Loan Amount |
|---|---|---|---|
| Open | Neasby Jimmy | $170,356 | |
| Previous Owner | Hamra Joseph H | $78,800 |
Source: Public Records
Tax History
| Year | Tax Paid | Tax Assessment Tax Assessment Total Assessment is a certain percentage of the fair market value that is determined by local assessors to be the total taxable value of land and additions on the property. | Land | Improvement |
|---|---|---|---|---|
| 2025 | $2,809 | $20,480 | $2,474 | $18,006 |
| 2024 | $2,693 | $19,855 | $2,491 | $17,364 |
| 2023 | $2,693 | $20,248 | $2,702 | $17,546 |
| 2022 | $2,621 | $18,657 | $2,895 | $15,762 |
| 2021 | $2,375 | $18,085 | $2,807 | $15,278 |
| 2020 | $2,390 | $18,085 | $2,807 | $15,278 |
| 2019 | $2,399 | $18,085 | $2,807 | $15,278 |
| 2018 | $2,377 | $18,085 | $2,807 | $15,278 |
| 2017 | $2,362 | $19,085 | $2,962 | $16,123 |
| 2016 | $1,845 | $14,305 | $2,962 | $11,343 |
| 2015 | $1,700 | $14,305 | $2,962 | $11,343 |
| 2014 | $1,617 | $13,123 | $2,717 | $10,406 |
Source: Public Records
Map
Nearby Homes
- 10227 E 115th St S
- 9745 E 116th Place S
- 13154 S 100th East Ave
- 9705 E 116th Place S
- 11523 S 105th East Ave
- 11725 S 101st East Ave
- 11711 S 96th East Place
- 11713 S 96th East Place
- 10607 E 115th St S
- 9528 E 117th St S
- 11721 S 104th East Ave
- 4713 S Retana Ave
- 11309 S 107th East Ave
- 9632 E 118th Place S
- 4705 S Retana Ave
- 3259 E 169th St S
- 3276 E 169th St S
- 3227 E 169th St S
- 3243 E 169th St S
- 9910 E 119th Place S
- 9928 E 115th St S
- 9931 E 116th St S
- 9937 E 116th St S
- 9922 E 115th St S
- 9939 E 115th St S
- 9948 E 115th St S
- 9923 E 116th St S
- 9933 E 115th St S
- 9943 E 116th St S
- 9945 E 115th St S
- 9916 E 115th St S
- 9927 E 115th St S
- 9949 E 115th St S
- 9917 E 116th St S
- 10107 E 116th St S
- 9921 E 115th St S
- 9940 E 114th Place S
- 9934 E 114th Place S
- 9926 E 114th Place S
- 11512 S 102nd East Ave
Your Personal Tour Guide
Ask me questions while you tour the home.