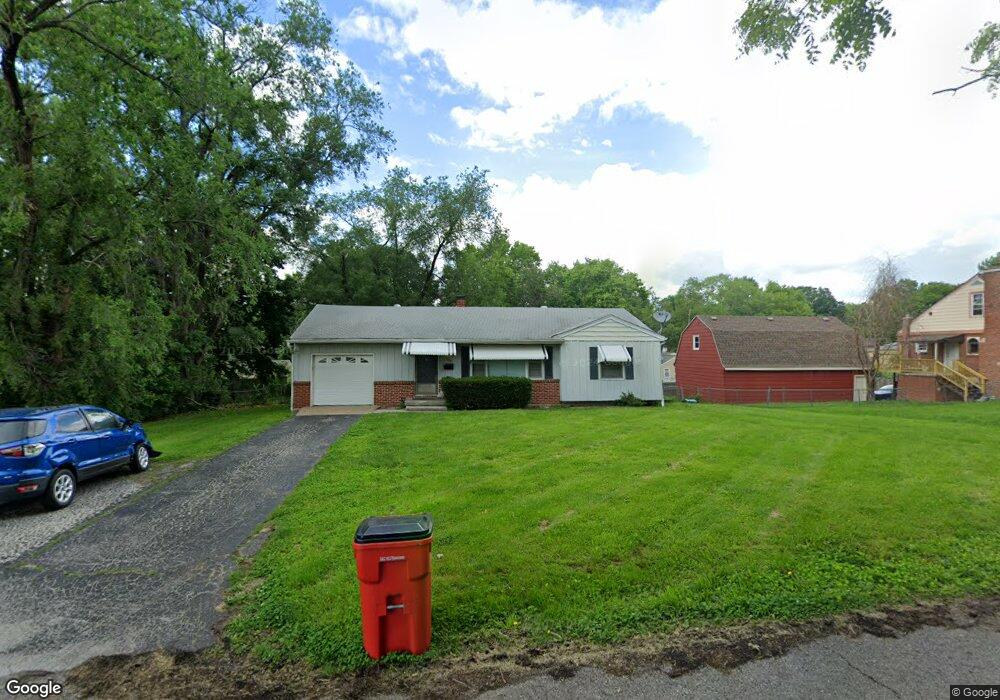
9936 E 36th St S Independence, MO 64052
Pitcher NeighborhoodEstimated Value: $154,657 - $181,000
4
Beds
1
Bath
1,002
Sq Ft
$173/Sq Ft
Est. Value
About This Home
This home is located at 9936 E 36th St S, Independence, MO 64052 and is currently estimated at $173,414, approximately $173 per square foot. 9936 E 36th St S is a home located in Jackson County with nearby schools including Three Trails Elementary School, Clifford H. Nowlin Middle School, and Van Horn High School.
Ownership History
Date
Name
Owned For
Owner Type
Purchase Details
Closed on
Jun 20, 2012
Sold by
Gibbs Frederick G and Gibbs Denise
Bought by
Benchmark Properties Ix Llc
Current Estimated Value
Purchase Details
Closed on
Sep 13, 2007
Sold by
Gibbs Frederick G and Gibbs Denise
Bought by
Gibbs Frederick G and Gibbs Denise
Home Financials for this Owner
Home Financials are based on the most recent Mortgage that was taken out on this home.
Original Mortgage
$100,700
Interest Rate
6.66%
Mortgage Type
Stand Alone Refi Refinance Of Original Loan
Purchase Details
Closed on
Feb 7, 2007
Sold by
Masters Janet L
Bought by
Masters Janet L
Purchase Details
Closed on
Jun 29, 2005
Sold by
Campbell Evelyn M
Bought by
Gibbs Frederick G
Home Financials for this Owner
Home Financials are based on the most recent Mortgage that was taken out on this home.
Original Mortgage
$20,000
Interest Rate
5.64%
Mortgage Type
Stand Alone Second
Purchase Details
Closed on
Dec 22, 1997
Sold by
Campbell Evelyn
Bought by
Campbell Evelyn and Campbell Family Trust
Create a Home Valuation Report for This Property
The Home Valuation Report is an in-depth analysis detailing your home's value as well as a comparison with similar homes in the area
Home Values in the Area
Average Home Value in this Area
Purchase History
We collect this data history from publicly available records. To have your information removed, we recommend requesting removal directly through your county’s website.
| Date | Buyer | Sale Price | Title Company |
|---|---|---|---|
| Benchmark Properties Ix Llc | -- | None Available | |
| Gibbs Frederick G | -- | None Available | |
| Masters Janet L | -- | None Available | |
| Gibbs Frederick G | -- | Ctic | |
| Campbell Evelyn | -- | -- |
Source: Public Records
Mortgage History
We collect this data history from publicly available records. To have your information removed, we recommend requesting removal directly through your county’s website.
| Date | Status | Borrower | Loan Amount |
|---|---|---|---|
| Previous Owner | Gibbs Frederick G | $100,700 | |
| Previous Owner | Gibbs Frederick G | $20,000 | |
| Previous Owner | Gibbs Frederick G | $74,950 |
Source: Public Records
Tax History
| Year | Tax Paid | Tax Assessment Tax Assessment Total Assessment is a certain percentage of the fair market value that is determined by local assessors to be the total taxable value of land and additions on the property. | Land | Improvement |
|---|---|---|---|---|
| 2025 | $1,370 | $17,338 | $3,572 | $13,766 |
| 2024 | $1,337 | $19,220 | $4,313 | $14,907 |
| 2023 | $1,337 | $19,221 | $3,561 | $15,660 |
| 2022 | $999 | $13,110 | $5,102 | $8,008 |
| 2021 | $995 | $13,110 | $5,102 | $8,008 |
| 2020 | $1,025 | $13,146 | $5,102 | $8,044 |
| 2019 | $1,009 | $13,146 | $5,102 | $8,044 |
| 2018 | $651 | $8,237 | $1,218 | $7,019 |
| 2017 | $579 | $8,237 | $1,218 | $7,019 |
| 2016 | $579 | $7,163 | $2,936 | $4,227 |
| 2014 | $551 | $6,954 | $2,850 | $4,104 |
Source: Public Records
Map
Nearby Homes
- 9930 E 36th St S
- 10105 E 35th St S
- 3407 S Cedar Ave
- 3410 Blue Ridge Blvd
- 3405 S Arlington Ave
- 9621 E 33rd St S
- 3401 S Denton Rd
- 1308, 1310, 1312, 13 S Hedges Ave
- 3216 S Hardy Ave
- 3320 Blue Ridge Blvd
- 9614 E 32nd St S
- 10601 E 33rd Terrace S
- 3407 S Blue Ridge Cut Off N A
- 9604 E 32nd St S
- 10115 E 31st St S
- 4018 Pittman Rd
- 3805 Laurel Ave
- 9502 Linwood Blvd
- 3101 Blue Ridge Blvd
- 10436 E 41st St
- 9915 E 35th Terrace S
- 9911 E 35th Terrace S
- 3510 Pittman Rd
- 9940 E 36th St S
- 9934 E 36th St S
- 9815 E 35th Terrace S
- 10001 E 35th Terrace S
- 9900 E 35th Terrace S
- 3506 Pittman Rd
- 9820 E 35th Terrace S
- 10003 E 35th Terrace S
- 10000 E 36th St S
- 9932 E 36th St S
- 9932 E 36th St S Unit 5
- 9932 E 36th St S Unit 2
- 9932 E 36th St S Unit 7
- 9932 E 36th St S Unit 9
- 9932 E 36th St S Unit 3
- 10000 E 35th Terrace S
- 10002 E 35th Terrace S
Your Personal Tour Guide
Ask me questions while you tour the home.