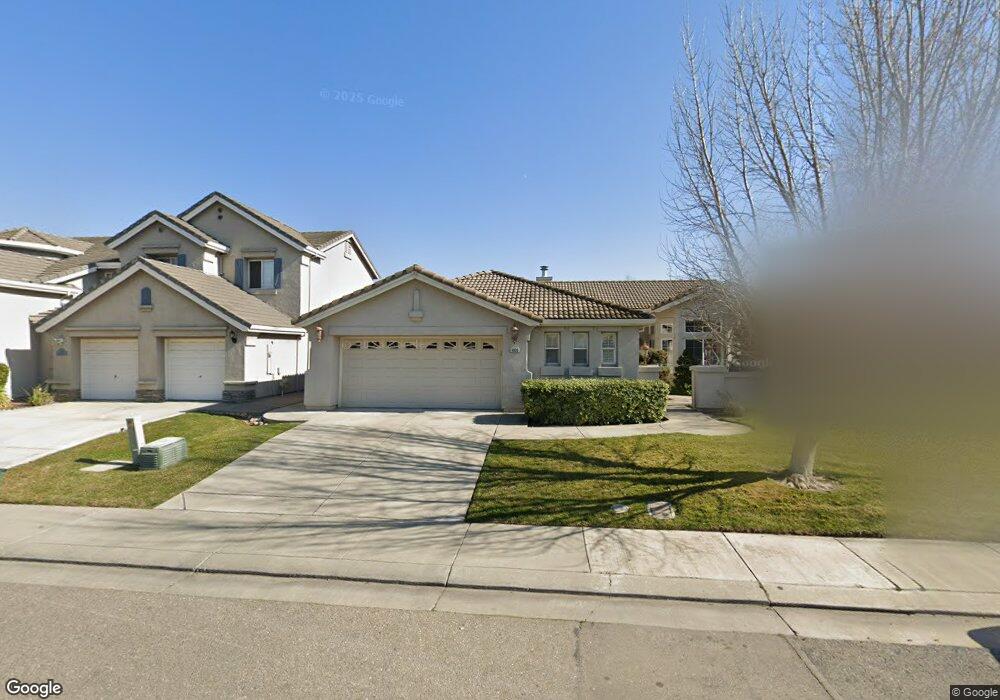
9936 Putnam Way Stockton, CA 95209
Spanos Park NeighborhoodEstimated Value: $475,000 - $559,000
3
Beds
2
Baths
1,756
Sq Ft
$286/Sq Ft
Est. Value
About This Home
This home is located at 9936 Putnam Way, Stockton, CA 95209 and is currently estimated at $501,927, approximately $285 per square foot. 9936 Putnam Way is a home located in San Joaquin County with nearby schools including John Muir Elementary School, Christa McAuliffe Middle School, and Bear Creek High School.
Ownership History
Date
Name
Owned For
Owner Type
Purchase Details
Closed on
May 22, 2023
Sold by
Stroud Thomas W
Bought by
Tom Stroud Family 2017 Living Trust
Current Estimated Value
Purchase Details
Closed on
Apr 10, 2017
Sold by
Olivarez Andrea O
Bought by
Stroud Thomas W
Purchase Details
Closed on
Feb 10, 2012
Sold by
Olivarez Andrea O and Andrea O Olivarez Revocable Tr
Bought by
Olivarez Andrea O
Purchase Details
Closed on
Sep 8, 2003
Sold by
Olivarez Andrea O
Bought by
Olivarez Andrea O and The Andrea O Olivarez Revocabl
Purchase Details
Closed on
Jul 5, 2000
Sold by
Frontier Land Companies
Bought by
Olivarez Andrea O
Home Financials for this Owner
Home Financials are based on the most recent Mortgage that was taken out on this home.
Original Mortgage
$160,250
Interest Rate
8.63%
Create a Home Valuation Report for This Property
The Home Valuation Report is an in-depth analysis detailing your home's value as well as a comparison with similar homes in the area
Home Values in the Area
Average Home Value in this Area
Purchase History
| Date | Buyer | Sale Price | Title Company |
|---|---|---|---|
| Tom Stroud Family 2017 Living Trust | -- | None Listed On Document | |
| Stroud Thomas W | $276,000 | Old Republic Title Company | |
| Olivarez Andrea O | -- | None Available | |
| Olivarez Andrea O | -- | -- | |
| Olivarez Andrea O | $179,000 | First American Title Co |
Source: Public Records
Mortgage History
| Date | Status | Borrower | Loan Amount |
|---|---|---|---|
| Previous Owner | Olivarez Andrea O | $160,250 |
Source: Public Records
Tax History Compared to Growth
Tax History
| Year | Tax Paid | Tax Assessment Tax Assessment Total Assessment is a certain percentage of the fair market value that is determined by local assessors to be the total taxable value of land and additions on the property. | Land | Improvement |
|---|---|---|---|---|
| 2025 | $3,628 | $320,313 | $111,991 | $208,322 |
| 2024 | $3,561 | $314,034 | $109,796 | $204,238 |
| 2023 | $3,520 | $307,878 | $107,644 | $200,234 |
| 2022 | $3,415 | $301,842 | $105,534 | $196,308 |
| 2021 | $3,495 | $295,924 | $103,465 | $192,459 |
| 2020 | $3,411 | $292,891 | $102,405 | $190,486 |
| 2019 | $3,332 | $287,149 | $100,398 | $186,751 |
| 2018 | $3,273 | $281,520 | $98,430 | $183,090 |
| 2017 | $2,682 | $231,220 | $51,931 | $179,289 |
| 2016 | $2,449 | $226,687 | $50,913 | $175,774 |
| 2014 | $2,417 | $218,912 | $49,167 | $169,745 |
Source: Public Records
Map
Nearby Homes
- 1927 Gerber Dr
- 1903 Chaparral Way
- 10148 Tony Ct
- 2140 Orvis Dr
- 2317 Estate Dr
- 10242 Creek Trail Cir
- 10014 River Bluff Ln
- 9511 Theresa Cir
- 1467 Green Ridge Dr
- 9431 Shawnee Ct
- 1626 Navajo Dr
- 2433 Broadridge Way
- 1145 Hartwell Ave
- 10622 Waterbury Dr
- 2316 Otto Dr
- 9421 Carter Ct
- 1146 Cypress Run Dr
- 9896 Thornton Rd
- 2306 Stanfield Dr
- 9409 Carter Ct