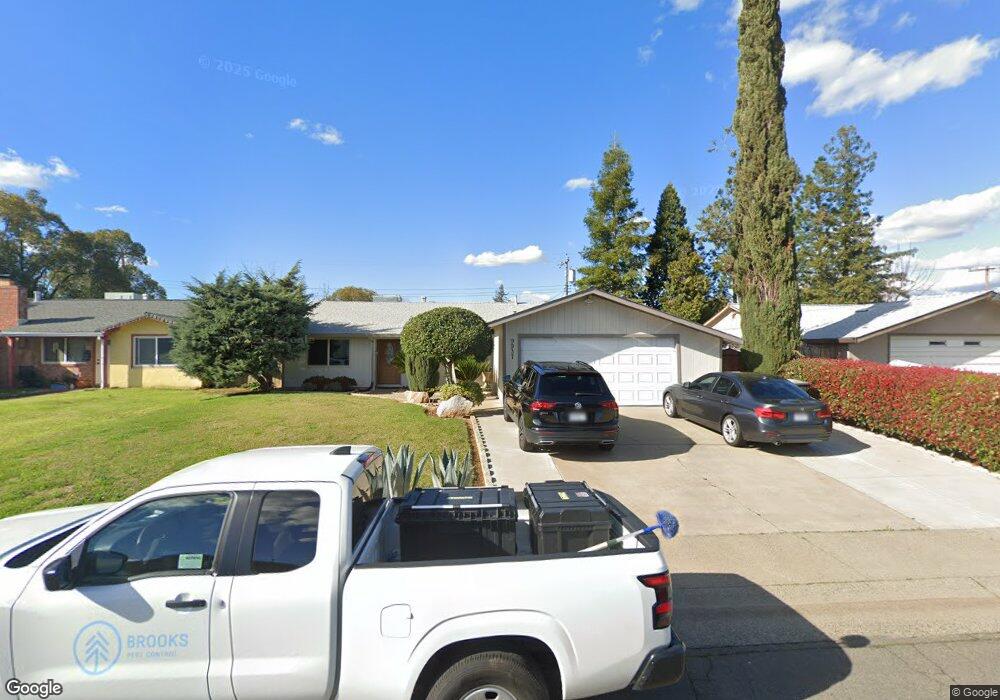
9937 Nebula Way Sacramento, CA 95827
Lincoln Village NeighborhoodEstimated Value: $249,000 - $395,000
3
Beds
1
Bath
1,064
Sq Ft
$326/Sq Ft
Est. Value
About This Home
This home is located at 9937 Nebula Way, Sacramento, CA 95827 and is currently estimated at $346,973, approximately $326 per square foot. 9937 Nebula Way is a home located in Sacramento County with nearby schools including Abraham Lincoln Elementary School, Albert Einstein Middle School, and Rosemont High School.
Ownership History
Date
Name
Owned For
Owner Type
Purchase Details
Closed on
Dec 20, 2021
Sold by
Arnaut Natalia
Bought by
Arnaut Natalia and Arnaut Vadim
Current Estimated Value
Purchase Details
Closed on
Nov 11, 2011
Sold by
Usko Home Inc
Bought by
Arnaut Natalia
Home Financials for this Owner
Home Financials are based on the most recent Mortgage that was taken out on this home.
Original Mortgage
$92,150
Outstanding Balance
$62,380
Interest Rate
3.87%
Mortgage Type
New Conventional
Estimated Equity
$284,593
Purchase Details
Closed on
May 11, 2011
Sold by
Federal National Mortgage Association
Bought by
Usko Home Inc
Purchase Details
Closed on
Aug 18, 2010
Sold by
Murphy Chikako
Bought by
Federal National Mortgage Association
Purchase Details
Closed on
Oct 12, 2001
Sold by
Murphy Chikako
Bought by
Murphy Chikako K and The Chikako K Murphy Family Tr
Create a Home Valuation Report for This Property
The Home Valuation Report is an in-depth analysis detailing your home's value as well as a comparison with similar homes in the area
Home Values in the Area
Average Home Value in this Area
Purchase History
| Date | Buyer | Sale Price | Title Company |
|---|---|---|---|
| Arnaut Natalia | -- | None Available | |
| Arnaut Natalia | $97,000 | Placer Title Company | |
| Usko Home Inc | $57,000 | Lawyers Title Insurance Corp | |
| Federal National Mortgage Association | $96,473 | Accommodation | |
| Murphy Chikako K | -- | -- |
Source: Public Records
Mortgage History
| Date | Status | Borrower | Loan Amount |
|---|---|---|---|
| Open | Arnaut Natalia | $92,150 |
Source: Public Records
Tax History Compared to Growth
Tax History
| Year | Tax Paid | Tax Assessment Tax Assessment Total Assessment is a certain percentage of the fair market value that is determined by local assessors to be the total taxable value of land and additions on the property. | Land | Improvement |
|---|---|---|---|---|
| 2025 | $1,419 | $121,824 | $37,676 | $84,148 |
| 2024 | $1,419 | $119,437 | $36,938 | $82,499 |
| 2023 | $1,383 | $117,096 | $36,214 | $80,882 |
| 2022 | $1,357 | $114,801 | $35,504 | $79,297 |
| 2021 | $1,292 | $112,551 | $34,808 | $77,743 |
| 2020 | $1,301 | $111,398 | $34,452 | $76,946 |
| 2019 | $1,271 | $109,215 | $33,777 | $75,438 |
| 2018 | $1,236 | $107,074 | $33,115 | $73,959 |
| 2017 | $1,217 | $104,975 | $32,466 | $72,509 |
| 2016 | $1,148 | $102,918 | $31,830 | $71,088 |
| 2015 | $1,130 | $101,373 | $31,352 | $70,021 |
| 2014 | $1,097 | $99,388 | $30,738 | $68,650 |
Source: Public Records
Map
Nearby Homes
- 9912 Zion Way
- 10039 Nebula Way
- 3413 Comet Ct
- 9728 Greensboro Cir
- 3604 Granby Dr
- 3593 Parc Villa Cir
- 3589 Parc Villa Cir
- 3605 Parc Villa Cir
- 3581 Parc Villa Cir
- 3123 Tenwoods Ct
- 3616 Parc Villa Rd
- 3616 Parc Villa Cir
- Plan 1844 at Westcott Station
- Plan 1587 Modeled at Westcott Station
- Plan 1755 Modeled at Westcott Station
- Plan 1644 at Westcott Station
- 3436 Skyward Ct
- 3435 Skyward Ct
- 3504 Misty Morning Cir
- 3118 Redcoat Ln
- 9941 Nebula Way
- 9933 Nebula Way
- 9924 Meteor Dr
- 9918 Meteor Dr
- 9945 Nebula Way
- 9929 Nebula Way
- 9930 Meteor Dr
- 9912 Meteor Dr
- 9940 Nebula Way
- 9936 Nebula Way
- 9944 Nebula Way
- 9949 Nebula Way
- 9925 Nebula Way
- 9936 Meteor Dr
- 9932 Nebula Way
- 9948 Nebula Way
- 9952 Nebula Way
- 9953 Nebula Way
- 9921 Nebula Way
- 9942 Meteor Dr