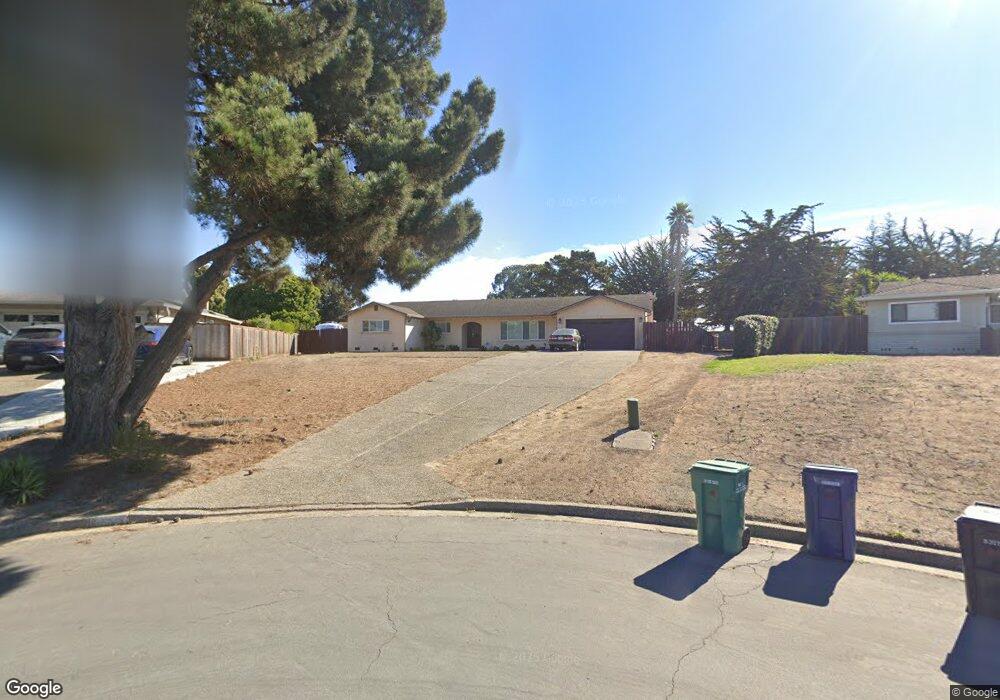
9937 Timothy Path Salinas, CA 93907
Estimated Value: $750,000 - $895,000
4
Beds
2
Baths
2,015
Sq Ft
$413/Sq Ft
Est. Value
About This Home
This home is located at 9937 Timothy Path, Salinas, CA 93907 and is currently estimated at $831,893, approximately $412 per square foot. 9937 Timothy Path is a home located in Monterey County with nearby schools including North Monterey County Middle School and North Monterey County High School.
Ownership History
Date
Name
Owned For
Owner Type
Purchase Details
Closed on
Feb 14, 2024
Sold by
Santos Agustin David and Santos Lucy Massey
Bought by
Agustin And Lucy Santos Revocable Living Trus and Santos
Current Estimated Value
Purchase Details
Closed on
Mar 27, 2014
Sold by
Henderson Ronnie
Bought by
Santos Agustin David and Santos Lucy
Purchase Details
Closed on
Dec 3, 2010
Sold by
Santos David A and Massey Lucy
Bought by
Henderson Ronnie V
Home Financials for this Owner
Home Financials are based on the most recent Mortgage that was taken out on this home.
Original Mortgage
$241,500
Interest Rate
4.18%
Mortgage Type
New Conventional
Purchase Details
Closed on
Apr 26, 2004
Sold by
Behnke Douglas J and Behnke Mary Anne
Bought by
Santos David A and Massey Lucy
Home Financials for this Owner
Home Financials are based on the most recent Mortgage that was taken out on this home.
Original Mortgage
$408,000
Interest Rate
6.12%
Mortgage Type
Purchase Money Mortgage
Create a Home Valuation Report for This Property
The Home Valuation Report is an in-depth analysis detailing your home's value as well as a comparison with similar homes in the area
Home Values in the Area
Average Home Value in this Area
Purchase History
| Date | Buyer | Sale Price | Title Company |
|---|---|---|---|
| Agustin And Lucy Santos Revocable Living Trus | -- | None Listed On Document | |
| Santos Agustin David | -- | None Available | |
| Henderson Ronnie V | $345,000 | Chicago Title Company | |
| Santos David A | $510,000 | Old Republic Title |
Source: Public Records
Mortgage History
| Date | Status | Borrower | Loan Amount |
|---|---|---|---|
| Previous Owner | Henderson Ronnie V | $241,500 | |
| Previous Owner | Santos David A | $408,000 |
Source: Public Records
Tax History
| Year | Tax Paid | Tax Assessment Tax Assessment Total Assessment is a certain percentage of the fair market value that is determined by local assessors to be the total taxable value of land and additions on the property. | Land | Improvement |
|---|---|---|---|---|
| 2025 | $5,866 | $539,369 | $171,615 | $367,754 |
| 2024 | $5,866 | $528,794 | $168,250 | $360,544 |
| 2023 | $5,759 | $518,426 | $164,951 | $353,475 |
| 2022 | $5,724 | $508,262 | $161,717 | $346,545 |
| 2021 | $5,509 | $498,297 | $158,547 | $339,750 |
| 2020 | $5,504 | $493,189 | $156,922 | $336,267 |
| 2019 | $5,378 | $483,520 | $153,846 | $329,674 |
| 2018 | $5,287 | $474,040 | $150,830 | $323,210 |
| 2017 | $4,998 | $464,746 | $147,873 | $316,873 |
| 2016 | $5,202 | $455,634 | $144,974 | $310,660 |
| 2015 | $5,016 | $448,791 | $142,797 | $305,994 |
| 2014 | $4,054 | $360,566 | $182,896 | $177,670 |
Source: Public Records
Map
Nearby Homes
- 9810 Rye Ct
- 9717 Trefoil Place
- 13910 Monte Del Oro Unit 72
- 13906 Monte Del Oro Unit 70
- 13226 Cielo Azul Unit 250
- 13622 Monte Del Sol Unit 141
- 13624 Monte Del Sol Unit 142
- 15105 Charter Oak Blvd
- 0 Benson Rd
- 0 Blackie Rd
- 15410 Oak Hills Dr
- 0 Del Monte Farms Rd
- 800 Dolan Rd Unit 40
- 800 Dolan Rd Unit 29
- 0 Castroville Blvd
- 10298 Tembladera St
- 10275 Merritt St
- 13265 Avila Rd
- 16475 Blackie Rd
- 35995 California 1
- 9929 Timothy Path
- 9952 Timothy Path
- 9926 Mimosa Path
- 9921 Timothy Path
- 9918 Mimosa Path
- 9944 Timothy Path
- 9934 Mimosa Path
- 9936 Timothy Path
- 9913 Timothy Path
- 9910 Mimosa Path
- 9928 Timothy Path
- 9920 Timothy Path
- 9927 Mimosa Path
- 9902 Mimosa Path
- 9905 Timothy Path
- 9912 Timothy Path
- 9911 Mimosa Path
- 9931 Pampas Path
- 9904 Timothy Path
- 9923 Pampas Path
Your Personal Tour Guide
Ask me questions while you tour the home.