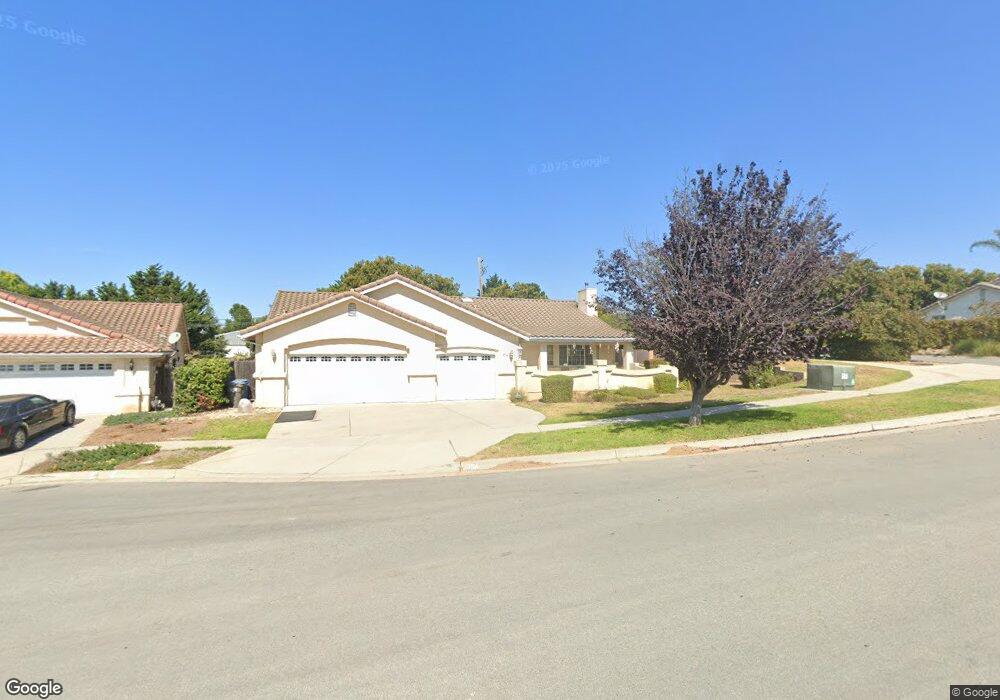
994 Vista Verde Ln Unit LT1 Nipomo, CA 93444
Estimated Value: $847,000 - $896,000
3
Beds
2
Baths
2,038
Sq Ft
$428/Sq Ft
Est. Value
About This Home
This home is located at 994 Vista Verde Ln Unit LT1, Nipomo, CA 93444 and is currently estimated at $872,631, approximately $428 per square foot. 994 Vista Verde Ln Unit LT1 is a home located in San Luis Obispo County with nearby schools including Dana Elementary School, Mesa Middle School, and Nipomo High School.
Ownership History
Date
Name
Owned For
Owner Type
Purchase Details
Closed on
Mar 11, 2024
Sold by
Ebner Frank and Ebner Anna Maria
Bought by
Ebner Family Trust and Ebner
Current Estimated Value
Purchase Details
Closed on
Jul 9, 2019
Sold by
Campbell Douglas R and Campbell Elaine K
Bought by
Ebner Frank and Ebner Anna Maria
Home Financials for this Owner
Home Financials are based on the most recent Mortgage that was taken out on this home.
Original Mortgage
$405,000
Interest Rate
3.82%
Mortgage Type
New Conventional
Purchase Details
Closed on
Jul 22, 2004
Sold by
R H Newdoll Construction Inc
Bought by
Campbell Douglas R and Campbell Elaine K
Home Financials for this Owner
Home Financials are based on the most recent Mortgage that was taken out on this home.
Original Mortgage
$419,900
Interest Rate
3.73%
Mortgage Type
Purchase Money Mortgage
Create a Home Valuation Report for This Property
The Home Valuation Report is an in-depth analysis detailing your home's value as well as a comparison with similar homes in the area
Home Values in the Area
Average Home Value in this Area
Purchase History
| Date | Buyer | Sale Price | Title Company |
|---|---|---|---|
| Ebner Family Trust | -- | None Listed On Document | |
| Ebner Frank | $540,000 | Fidelity National Title | |
| Campbell Douglas R | $560,000 | Fidelity Title Company |
Source: Public Records
Mortgage History
| Date | Status | Borrower | Loan Amount |
|---|---|---|---|
| Previous Owner | Ebner Frank | $405,000 | |
| Previous Owner | Campbell Douglas R | $419,900 |
Source: Public Records
Tax History Compared to Growth
Tax History
| Year | Tax Paid | Tax Assessment Tax Assessment Total Assessment is a certain percentage of the fair market value that is determined by local assessors to be the total taxable value of land and additions on the property. | Land | Improvement |
|---|---|---|---|---|
| 2025 | $6,074 | $590,564 | $251,536 | $339,028 |
| 2024 | $6,005 | $578,985 | $246,604 | $332,381 |
| 2023 | $6,005 | $567,633 | $241,769 | $325,864 |
| 2022 | $5,914 | $556,504 | $237,029 | $319,475 |
| 2021 | $5,903 | $545,593 | $232,382 | $313,211 |
| 2020 | $5,836 | $540,000 | $230,000 | $310,000 |
| 2019 | $6,453 | $596,000 | $180,000 | $416,000 |
| 2018 | $5,885 | $540,000 | $165,000 | $375,000 |
| 2017 | $5,791 | $531,000 | $160,000 | $371,000 |
| 2016 | $5,507 | $525,000 | $160,000 | $365,000 |
| 2015 | $5,000 | $477,000 | $145,000 | $332,000 |
| 2014 | $4,911 | $477,000 | $145,000 | $332,000 |
Source: Public Records
Map
Nearby Homes
- 261 Hazel Ln
- 426 Polaris Dr
- 393 Uranus Ct
- 1127 Starlite Dr
- 457 Polaris Dr
- 1180 Starlite Dr
- 945 Jeanette Ln
- 468 Neptune Dr
- 759 Viola Ct
- 219 Lema Dr
- 719 W Tefft St
- 615 Sweet Donna Place
- 1431 La Loma Dr
- 217 Hope Way
- 875 Camino Caballo
- 522 Higos Way
- 680 Hill St
- 232 Scarlett Cir
- Mesa Plan at Hill Street Terraces - Hill Street Series
- Pacific Plan at Hill Street Terraces - Hill Street Series
- 994 Vista Verde Ln
- 996 Vista Verde Ln Unit LT2
- 996 Vista Verde Ln
- 968 Vista Verde Ln
- 995 Vista Verde Ln
- 998 Vista Verde Ln Unit LT3
- 998 Vista Verde Ln
- 997 Vista Verde Ln
- 999 Vista Verde Ln
- 966 Vista Verde Ln
- 969 Vista Verde Ln
- 115 Tejas Place
- 4 Martha Ln
- 2 Martha Ln
- 994 Ida Place
- 967 Vista Verde Ln
- 964 Vista Verde Ln
- 115 Gertie Place
- 970 Ida Place
- 965 Vista Verde Ln