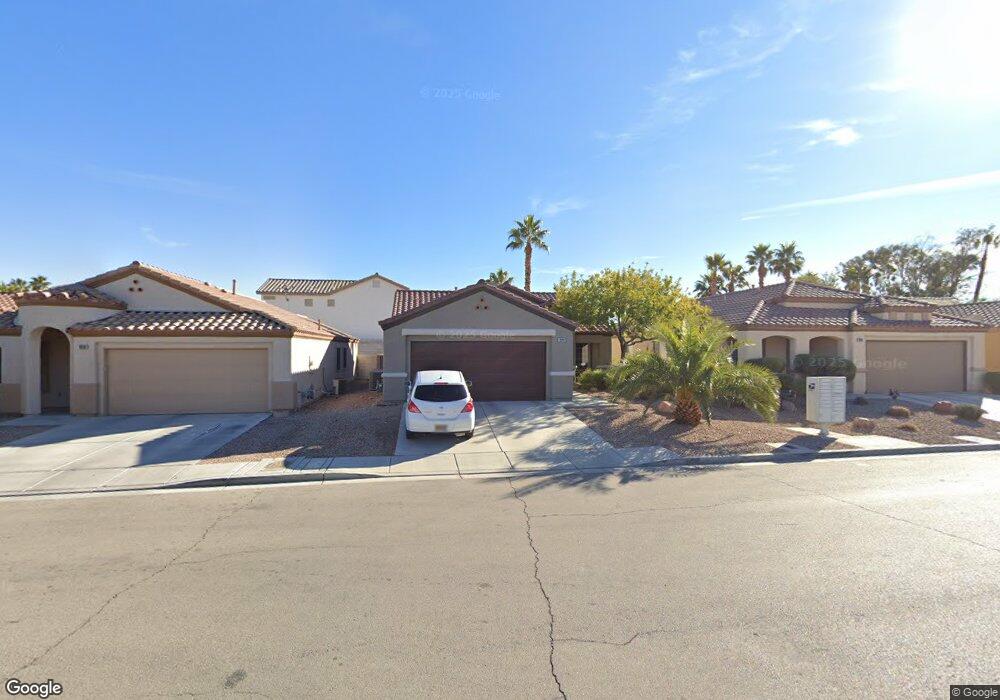
9940 Rose Charmont St Las Vegas, NV 89183
Silverado Ranch NeighborhoodEstimated Value: $395,000 - $423,000
3
Beds
2
Baths
1,308
Sq Ft
$313/Sq Ft
Est. Value
About This Home
This home is located at 9940 Rose Charmont St, Las Vegas, NV 89183 and is currently estimated at $409,368, approximately $312 per square foot. 9940 Rose Charmont St is a home located in Clark County with nearby schools including John R. Hummel Elementary School, Charles Silvestri Junior High School, and Liberty High School.
Ownership History
Date
Name
Owned For
Owner Type
Purchase Details
Closed on
Jul 6, 2007
Sold by
Ingram Gregory and Ingram Renee
Bought by
Varone James R and Wright Kimberly A
Current Estimated Value
Home Financials for this Owner
Home Financials are based on the most recent Mortgage that was taken out on this home.
Original Mortgage
$210,400
Outstanding Balance
$133,214
Interest Rate
6.75%
Mortgage Type
Unknown
Estimated Equity
$276,154
Purchase Details
Closed on
Nov 25, 2002
Sold by
George D Baranek Trust
Bought by
Ingram Gregory and Ingram Renee
Home Financials for this Owner
Home Financials are based on the most recent Mortgage that was taken out on this home.
Original Mortgage
$143,900
Interest Rate
6.12%
Purchase Details
Closed on
Jul 11, 2000
Sold by
Baranek George D
Bought by
George D Baranek Trust
Purchase Details
Closed on
Jul 23, 1999
Sold by
Kaufman & Broad Of Nevada Inc
Bought by
Baranek George D
Home Financials for this Owner
Home Financials are based on the most recent Mortgage that was taken out on this home.
Original Mortgage
$124,318
Interest Rate
7.51%
Mortgage Type
VA
Create a Home Valuation Report for This Property
The Home Valuation Report is an in-depth analysis detailing your home's value as well as a comparison with similar homes in the area
Home Values in the Area
Average Home Value in this Area
Purchase History
| Date | Buyer | Sale Price | Title Company |
|---|---|---|---|
| Varone James R | $263,000 | Lawyers Title Of Nevada | |
| Ingram Gregory | $159,950 | Land Title | |
| George D Baranek Trust | -- | -- | |
| Baranek George D | $121,000 | United Title |
Source: Public Records
Mortgage History
| Date | Status | Borrower | Loan Amount |
|---|---|---|---|
| Open | Varone James R | $210,400 | |
| Previous Owner | Ingram Gregory | $143,900 | |
| Previous Owner | Baranek George D | $124,318 |
Source: Public Records
Tax History Compared to Growth
Tax History
| Year | Tax Paid | Tax Assessment Tax Assessment Total Assessment is a certain percentage of the fair market value that is determined by local assessors to be the total taxable value of land and additions on the property. | Land | Improvement |
|---|---|---|---|---|
| 2025 | $1,525 | $95,851 | $39,550 | $56,301 |
| 2024 | $1,481 | $95,851 | $39,550 | $56,301 |
| 2023 | $1,481 | $86,094 | $32,900 | $53,194 |
| 2022 | $1,576 | $76,443 | $27,650 | $48,793 |
| 2021 | $1,460 | $74,031 | $27,650 | $46,381 |
| 2020 | $1,353 | $73,651 | $27,650 | $46,001 |
| 2019 | $1,268 | $64,995 | $19,600 | $45,395 |
| 2018 | $1,210 | $61,305 | $17,500 | $43,805 |
| 2017 | $1,796 | $61,222 | $16,800 | $44,422 |
| 2016 | $1,133 | $56,547 | $11,900 | $44,647 |
| 2015 | $1,130 | $38,477 | $8,050 | $30,427 |
| 2014 | $1,095 | $36,219 | $7,000 | $29,219 |
Source: Public Records
Map
Nearby Homes
- 10013 Solid Lime St
- 10025 Catseye Cove Ct
- 638 Ribbon Grass Ave
- 9854 Canterbury Creek St
- 710 Elliot Peak Ave
- 506 Green Gables Ave
- 9801 Bradford Summit St
- 10133 Rice Paper St
- 9792 Cordova Vista Ct
- 10142 Rice Paper St
- 10164 Tree Bark St
- 829 Dancing Vines Ave
- 10151 Tumbling Tree St
- 10208 Ghost Gum St
- 754 Canfield Point Ave
- 694 Baldurn Ave
- 555 E Silverado Ranch Blvd Unit 2075
- 555 E Silverado Ranch Blvd Unit 2130
- 555 E Silverado Ranch Blvd Unit 2168
- 555 E Silverado Ranch Blvd Unit 2064
- 9950 Rose Charmont St
- 9930 Rose Charmont St
- 611 Emerald City Ave
- 9920 Rose Charmont St
- 9920 Rose Charmont St Unit n/a
- 9960 Rose Charmont St
- 618 Gritty Garnet Ave
- 617 Emerald City Ave
- 9970 Rose Charmont St
- 9910 Rose Charmont St
- 9931 Rose Charmont St
- 581 Morning Mauve Ave
- 623 Emerald City Ave
- 9980 Rose Charmont St
- 624 Gritty Garnet Ave
- 610 Emerald City Ave
- 571 Morning Mauve Ave
- 9911 Rose Charmont St
- 9963 Solid Lime St Unit n/a
- 9963 Solid Lime St