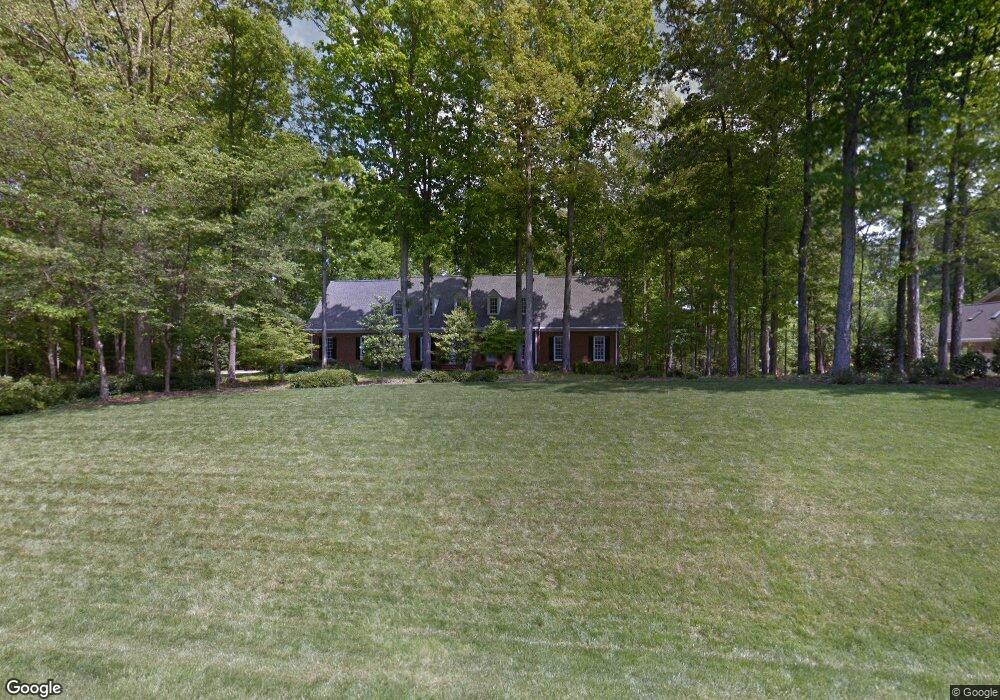
9944 Koupela Dr Raleigh, NC 27614
Falls Lake NeighborhoodEstimated Value: $986,000 - $1,394,000
4
Beds
4
Baths
4,000
Sq Ft
$292/Sq Ft
Est. Value
About This Home
This home is located at 9944 Koupela Dr, Raleigh, NC 27614 and is currently estimated at $1,169,014, approximately $292 per square foot. 9944 Koupela Dr is a home located in Wake County with nearby schools including Brassfield Elementary School, West Millbrook Middle School, and Millbrook High School.
Ownership History
Date
Name
Owned For
Owner Type
Purchase Details
Closed on
Dec 13, 2004
Sold by
Prudential Residential Services Lp
Bought by
Kemp Daniel M and Kemp Judith E
Current Estimated Value
Home Financials for this Owner
Home Financials are based on the most recent Mortgage that was taken out on this home.
Original Mortgage
$275,000
Outstanding Balance
$137,537
Interest Rate
5.71%
Mortgage Type
Fannie Mae Freddie Mac
Estimated Equity
$1,031,477
Purchase Details
Closed on
Nov 13, 2004
Sold by
Ottney David P and Ottney Patricia A
Bought by
Prudential Residential Services Lp and Prudential Homes Corp
Home Financials for this Owner
Home Financials are based on the most recent Mortgage that was taken out on this home.
Original Mortgage
$275,000
Outstanding Balance
$137,537
Interest Rate
5.71%
Mortgage Type
Fannie Mae Freddie Mac
Estimated Equity
$1,031,477
Create a Home Valuation Report for This Property
The Home Valuation Report is an in-depth analysis detailing your home's value as well as a comparison with similar homes in the area
Home Values in the Area
Average Home Value in this Area
Purchase History
| Date | Buyer | Sale Price | Title Company |
|---|---|---|---|
| Kemp Daniel M | $575,000 | -- | |
| Prudential Residential Services Lp | $575,000 | -- |
Source: Public Records
Mortgage History
| Date | Status | Borrower | Loan Amount |
|---|---|---|---|
| Open | Kemp Daniel M | $275,000 |
Source: Public Records
Tax History Compared to Growth
Tax History
| Year | Tax Paid | Tax Assessment Tax Assessment Total Assessment is a certain percentage of the fair market value that is determined by local assessors to be the total taxable value of land and additions on the property. | Land | Improvement |
|---|---|---|---|---|
| 2025 | $4,976 | $774,931 | $360,000 | $414,931 |
| 2024 | $4,832 | $774,931 | $360,000 | $414,931 |
| 2023 | $4,885 | $623,932 | $170,000 | $453,932 |
| 2022 | $4,526 | $623,932 | $170,000 | $453,932 |
| 2021 | $4,404 | $623,932 | $170,000 | $453,932 |
| 2020 | $4,331 | $623,932 | $170,000 | $453,932 |
| 2019 | $5,248 | $640,116 | $150,000 | $490,116 |
| 2018 | $4,823 | $640,116 | $150,000 | $490,116 |
| 2017 | $4,571 | $640,116 | $150,000 | $490,116 |
| 2016 | $4,478 | $640,116 | $150,000 | $490,116 |
| 2015 | $4,511 | $646,675 | $155,000 | $491,675 |
| 2014 | $4,275 | $646,675 | $155,000 | $491,675 |
Source: Public Records
Map
Nearby Homes
- 9925 Koupela Dr
- 4817 Fox Branch Ct
- 1209 Ravens Point Cir
- 4708 Wynneford Way
- 5420 Deer Forest Trail
- 10630 Pleasant Branch Dr Unit Lot 5
- 10545 Pleasant Branch Dr Unit 101
- 10610 Pleasant Branch Dr Unit Lot 15
- 10610 Pleasant Branch Dr Unit Lot 13
- 10608 Pleasant Branch Dr Unit Lot 14
- 10602 Pleasant Branch Dr Unit Lot 17
- 10562 Pleasant Branch Dr Unit Lot 18
- 10553 Pleasant Branch Dr Unit 201
- 10553 Pleasant Branch Dr Unit 101
- 10560 Pleasant Branch Dr Unit Lot 19
- 10551 Pleasant Branch Dr Unit 201
- 10551 Pleasant Branch Dr Unit 101
- 10549 Pleasant Branch Dr Unit 201
- 10549 Pleasant Branch Dr Unit 101
- 10558 Pleasant Branch Dr Unit Lot 20
- 9948 Koupela Dr
- 11709 Raven Ridge Rd
- 9945 Koupela Dr
- 9941 Koupela Dr
- 9949 Koupela Dr
- 9937 Koupela Dr
- 9932 Koupela Dr
- 9933 Koupela Dr
- 9953 Koupela Dr
- 9928 Koupela Dr
- 9929 Koupela Dr
- 11724 Raven Ridge Rd
- 0 Raven Ridge Rd
- 4941 Cremshaw Ct
- 9924 Koupela Dr
- 900 Stone Falls Trail
- 4937 Cremshaw Ct
- 9921 Koupela Dr
- 902 Stone Falls Trail
- 9920 Koupela Dr