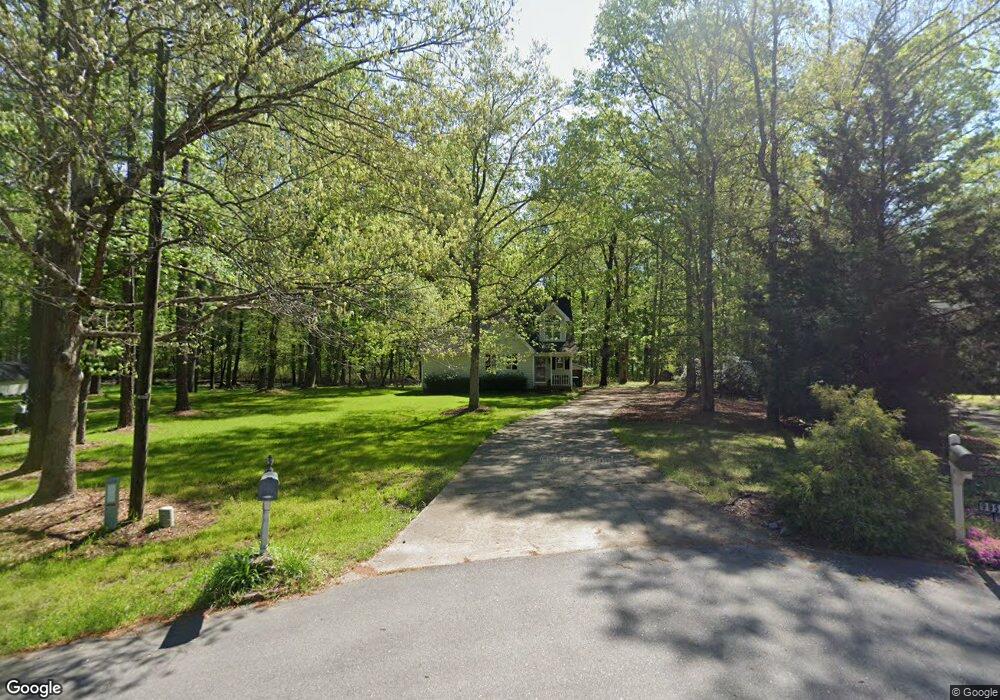
9949 Huntwyck Dr Raleigh, NC 27603
Estimated Value: $348,000 - $374,524
3
Beds
2
Baths
1,626
Sq Ft
$222/Sq Ft
Est. Value
About This Home
This home is located at 9949 Huntwyck Dr, Raleigh, NC 27603 and is currently estimated at $361,131, approximately $222 per square foot. 9949 Huntwyck Dr is a home located in Wake County with nearby schools including Rand Road Elementary, North Garner Middle, and South Garner High.
Ownership History
Date
Name
Owned For
Owner Type
Purchase Details
Closed on
Jun 10, 2016
Sold by
Eaddy Jason and Eaddy Tessa
Bought by
White Eric J
Current Estimated Value
Home Financials for this Owner
Home Financials are based on the most recent Mortgage that was taken out on this home.
Original Mortgage
$163,400
Outstanding Balance
$130,428
Interest Rate
3.66%
Mortgage Type
New Conventional
Estimated Equity
$230,703
Purchase Details
Closed on
Mar 13, 2012
Sold by
White Paul and White Susan
Bought by
Eaddy Jason and Eaddy Tessa
Home Financials for this Owner
Home Financials are based on the most recent Mortgage that was taken out on this home.
Original Mortgage
$140,714
Interest Rate
3.89%
Mortgage Type
New Conventional
Purchase Details
Closed on
Nov 15, 2011
Sold by
Mote Susan Bridges
Bought by
White Paul
Purchase Details
Closed on
Sep 1, 2010
Sold by
Mote Susan
Bought by
Mote Land Trust
Create a Home Valuation Report for This Property
The Home Valuation Report is an in-depth analysis detailing your home's value as well as a comparison with similar homes in the area
Home Values in the Area
Average Home Value in this Area
Purchase History
| Date | Buyer | Sale Price | Title Company |
|---|---|---|---|
| White Eric J | $172,000 | None Available | |
| Eaddy Jason | $138,000 | None Available | |
| White Paul | $63,803 | None Available | |
| Mote Land Trust | -- | None Available |
Source: Public Records
Mortgage History
| Date | Status | Borrower | Loan Amount |
|---|---|---|---|
| Open | White Eric J | $163,400 | |
| Previous Owner | Eaddy Jason | $140,714 |
Source: Public Records
Tax History Compared to Growth
Tax History
| Year | Tax Paid | Tax Assessment Tax Assessment Total Assessment is a certain percentage of the fair market value that is determined by local assessors to be the total taxable value of land and additions on the property. | Land | Improvement |
|---|---|---|---|---|
| 2025 | $2,030 | $314,271 | $110,000 | $204,271 |
| 2024 | $1,972 | $314,271 | $110,000 | $204,271 |
| 2023 | $1,510 | $191,117 | $42,900 | $148,217 |
| 2022 | $1,400 | $191,117 | $42,900 | $148,217 |
| 2021 | $1,363 | $191,117 | $42,900 | $148,217 |
| 2020 | $1,341 | $191,117 | $42,900 | $148,217 |
| 2019 | $1,241 | $149,489 | $35,000 | $114,489 |
| 2018 | $1,142 | $149,489 | $35,000 | $114,489 |
| 2017 | $1,083 | $149,489 | $35,000 | $114,489 |
| 2016 | $1,061 | $149,489 | $35,000 | $114,489 |
| 2015 | $978 | $138,011 | $35,000 | $103,011 |
| 2014 | -- | $138,011 | $35,000 | $103,011 |
Source: Public Records
Map
Nearby Homes
- 10001 Joe Leach Rd
- 5013 Contender Dr
- 1101 Robinfield Dr
- 9017 Hunterfox Ct
- 1559 Upchurch Woods Dr
- 920 Shadywood Ln
- 1009 Feldmen Dr
- 449 Kings Hollow Dr
- 6009 Swales Way
- 6109 Oak Passage Dr
- 1004 Snow Peak Ct
- 8500 Old Ponderosa Cir
- 6121 Catandpolly Ln
- 6257 Oak Passage Dr
- 700 Arbor Greene Dr
- 4117 Bashford Bluffs Ln
- 701 Rand Rd
- 316 Arbor Greene Dr
- 1021 Wintu Ct
- 1005 Turner Meadow Dr
- 9953 Huntwyck Dr
- 9945 Huntwyck Dr
- 9957 Huntwyck Dr
- 9948 Huntwyck Dr
- 9952 Huntwyck Dr
- 200 Lassiter Farm Rd
- 9944 Huntwyck Dr
- 201 Lassiter Farm Rd
- 9940 Huntwyck Dr
- 9941 Huntwyck Dr
- 204 Lassiter Farm Rd
- 9936 Huntwyck Dr
- 909 Shannondale Dr
- 205 Lassiter Farm Rd
- 913 Shannondale Dr
- 905 Shannondale Dr
- 208 Lassiter Farm Rd
- 9937 Huntwyck Dr
- 921 Shannondale Dr
- 9925 Huntwyck Dr