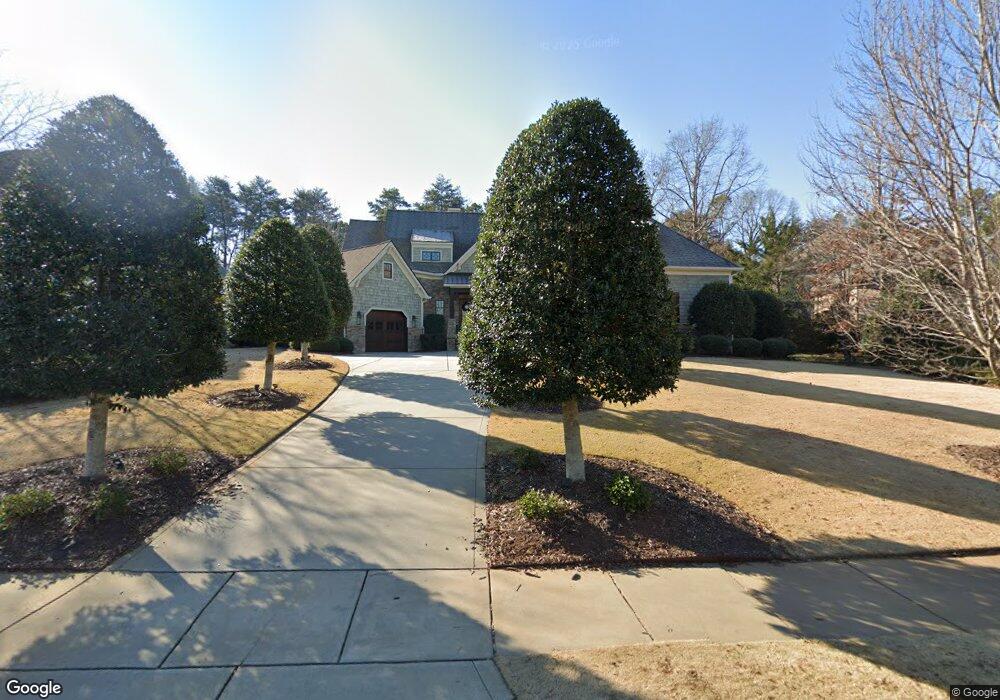
995 Wessington Manor Ln Unit , 32 Fort Mill, SC 29715
Springfield NeighborhoodEstimated Value: $1,323,000 - $1,340,591
--
Bed
1
Bath
4,134
Sq Ft
$322/Sq Ft
Est. Value
About This Home
This home is located at 995 Wessington Manor Ln Unit , 32, Fort Mill, SC 29715 and is currently estimated at $1,332,530, approximately $322 per square foot. 995 Wessington Manor Ln Unit , 32 is a home located in York County with nearby schools including Fort Mill Elementary School, Fort Mill Middle School, and Nation Ford High School.
Ownership History
Date
Name
Owned For
Owner Type
Purchase Details
Closed on
Nov 7, 2018
Sold by
Richardson Stepps Samello A and Stepps Palace V
Bought by
Richardson Stepps Samello Allegra and Stepps Palace Vandurin
Current Estimated Value
Purchase Details
Closed on
Jul 10, 2015
Sold by
Quinn Michael P
Bought by
Richardson Stepps Samello A and Stepps Palace V
Home Financials for this Owner
Home Financials are based on the most recent Mortgage that was taken out on this home.
Original Mortgage
$486,000
Outstanding Balance
$381,844
Interest Rate
4.08%
Mortgage Type
New Conventional
Estimated Equity
$950,686
Purchase Details
Closed on
Jan 19, 2010
Sold by
Stevens Construction Group Inc
Bought by
Quinn Michael P
Purchase Details
Closed on
Oct 24, 2006
Sold by
Springfield Crescent Llc
Bought by
Stevens Construction Group Inc
Create a Home Valuation Report for This Property
The Home Valuation Report is an in-depth analysis detailing your home's value as well as a comparison with similar homes in the area
Home Values in the Area
Average Home Value in this Area
Purchase History
| Date | Buyer | Sale Price | Title Company |
|---|---|---|---|
| Richardson Stepps Samello Allegra | -- | None Available | |
| Richardson Stepps Samello A | $785,000 | -- | |
| Quinn Michael P | $157,000 | -- | |
| Stevens Construction Group Inc | $164,000 | None Available |
Source: Public Records
Mortgage History
| Date | Status | Borrower | Loan Amount |
|---|---|---|---|
| Open | Richardson Stepps Samello A | $486,000 |
Source: Public Records
Tax History Compared to Growth
Tax History
| Year | Tax Paid | Tax Assessment Tax Assessment Total Assessment is a certain percentage of the fair market value that is determined by local assessors to be the total taxable value of land and additions on the property. | Land | Improvement |
|---|---|---|---|---|
| 2024 | $7,378 | $30,491 | $7,000 | $23,491 |
| 2023 | $7,215 | $30,500 | $7,000 | $23,500 |
| 2022 | $7,002 | $30,500 | $7,000 | $23,500 |
| 2021 | -- | $30,500 | $7,000 | $23,500 |
| 2020 | $7,291 | $30,500 | $0 | $0 |
| 2019 | $21,739 | $42,510 | $0 | $0 |
| 2018 | $8,211 | $28,340 | $0 | $0 |
| 2017 | $7,888 | $28,340 | $0 | $0 |
| 2016 | $20,400 | $42,510 | $0 | $0 |
| 2014 | $5,526 | $28,340 | $5,800 | $22,540 |
| 2013 | $5,526 | $25,700 | $5,000 | $20,700 |
Source: Public Records
Map
Nearby Homes
- 253 Buckner Hill Ln
- 126 Gragg House Rd
- 1565 Kennel Rd
- 3128 Beacon Heights Rd
- 3149 Beacon Heights Rd
- 3116 Beacon Heights Rd
- 3161 Beacon Heights Rd
- 3151 Beacon Heights Rd
- 3155 Beacon Heights Rd
- 3159 Beacon Heights Rd
- 3157 Beacon Heights Rd
- 3139 Beacon Heights Rd
- 3135 Beacon Heights Rd
- 3127 Beacon Heights Rd
- 3117 Beacon Heights Rd
- 3131 Beacon Heights Rd
- 8672 Miles Gap Rd
- 8668 Miles Gap Rd
- 995 Wessington Manor Ln
- 989 Wessington Manor Ln
- 989 Wessington Manor Ln Unit ,33
- 1001 Wessington Manor Ln
- 1008 Wessington Manor Ln
- 983 Wessington Manor Ln
- 983 Wessington Manor Ln Unit 34
- 996 Wessington Manor Ln
- 996 Wessington Manor Ln Unit 69
- 990 Wessington Manor Ln
- 990 Wessington Manor Ln Unit 70
- 405 Latimer Ln
- 984 Wessington Manor Ln
- 409 Latimer Ln
- 426 Latimer Ln
- 978 Wessington Manor Ln
- 413 Latimer Ln
- 971 Wessington Manor Ln
- 1027 Wessington Manor Ln
- 434 Latimer Ln